

(Kitco NewsWire) - Spot gold and silver prices are sharply lower in early U.S. trading Thursday, after hotter U.S. wholesale inflation, steady jobless claims and a 25-basis-point ECB rate hike reinforced the global higher-for-longer rate trade. At the time of writing, spot gold was trading near $4,362.30 an ounce, down 0.87%, while spot silver was trading at $64.920, down 3.34% on the session.
The latest positioning shifted against precious metals after August PPI rose 0.4% on the month and 5.4% from a year earlier, with core producer prices up 0.3% on the month and 4.7% year-over-year. Goods inflation did the damage, led by a 4.2% jump in energy and a 24.1% surge in diesel fuel. Weekly jobless claims fell to 206,000 from a revised 207,000, and continuing claims slipped to 1.774 million, keeping the labor market firm enough to deny gold a growth-scare bid. The ECB also raised its benchmark rate by 25 basis points to 2.50%, citing energy-driven inflation pressure from the Iran war. Markets were still pricing roughly a 60% probability of a Fed hike at the Sept. 15-16 meeting, with the 10-year Treasury yield trading near the 4.8% area. Friday’s CPI report is now the final major inflation input before the Fed decision.
Gold and silver are trading as a rates-and-dollar market, not a clean safe-haven market. Gold lost the $4,396 to $4,422 area and tested toward the $4,341 200-day EMA reference, while silver broke below the $65.718 200-day EMA and the $65.471 50-day EMA. The selloff shows that oil-driven inflation is now working against metals through the yield channel faster than it is supporting them through geopolitical demand. Bulls need Friday’s CPI to cool, or the next move risks being another downside test rather than a rebound.
The Strait of Hormuz remains the main geopolitical channel into oil, inflation expectations and defensive demand. Brent crude remains near the $100 area after the latest U.S.-Iran escalation, with fighting still disrupting tanker flows through the waterway. The ECB’s rate hike underscored the global policy impact of that shock: Europe is importing higher energy costs, while the U.S. is seeing the pass-through in producer prices. For gold, the setup remains conflicted: Hormuz risk supports safe-haven demand, but higher oil is lifting inflation expectations, keeping yields elevated and strengthening the case for another Fed hike.
Global markets were mixed to weaker after the PPI release. U.S. stock-index futures were under pressure as the inflation print followed three straight down sessions for equities. European markets were lower as investors absorbed the ECB rate increase and higher energy prices, while Asian markets were mixed. The bond market remains the cross-asset anchor, with traders focused on whether Friday’s CPI confirms the PPI signal.
The key outside markets see Nymex WTI crude oil prices firmer and trading around the $90 area, while Brent crude was near the $100 area. The yield on the benchmark 10-year U.S. Treasury note is trading near the 4.8% area. The U.S. dollar index is firmer after the data. (Kitco Global Index shows how much of today's gold move is the dollar versus the gold market itself.)
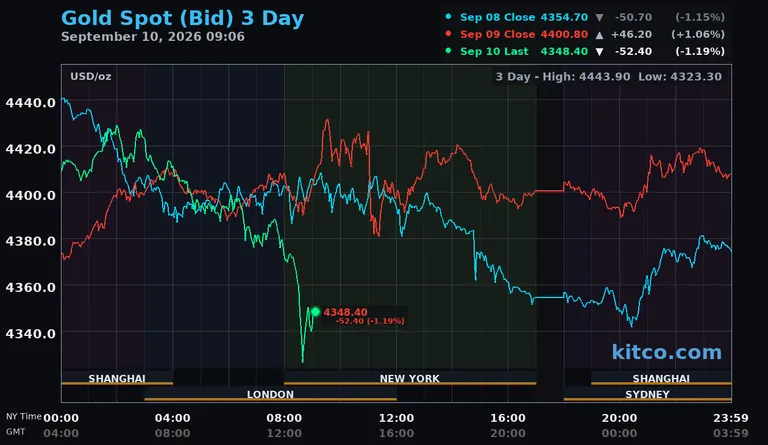
Technically, spot gold bulls' next upside price objective is to push prices back above the $4,396.30 resistance level, with a sustained move targeting $4,500.00. Bears' next near-term downside price objective is a break below $4,341.10, with deeper downside targets at $4,290.00 and then $4,263.00. First resistance is seen at $4,396.30 and then at $4,500.00. First support is seen at $4,341.10 and then at $4,290.00.
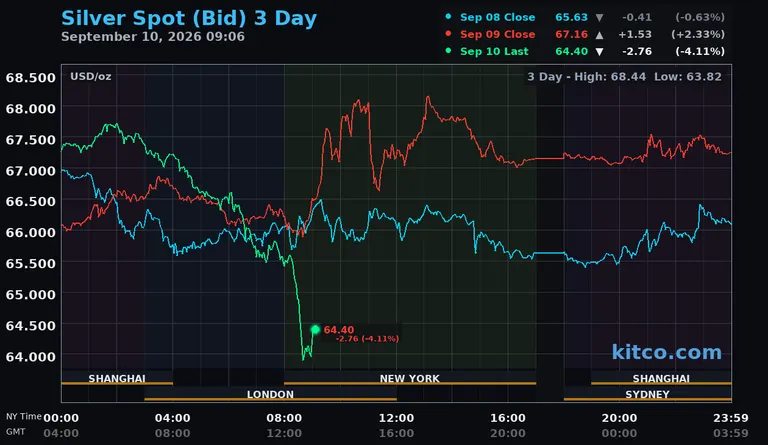
Spot silver bulls' next upside price objective is to drive prices back above $65.718, with a move above that level targeting $67.25 and then $68.17. The next downside price objective for the bears is a break below $63.31, with deeper downside targets at $62.57 and then $62.56. First resistance is seen at $65.718 and then at $67.25. Next support is seen at $63.31 and then at $62.57.
See live precious metals prices for gold, silver, platinum and palladium — in USD, CAD and 12 more currencies.

