

(Kitco NewsWire) - Spot gold and silver prices are sharply lower in late-afternoon U.S. trading Thursday, as hotter wholesale inflation, a crude-oil surge and a jump in Treasury yields overwhelmed safe-haven demand tied to the U.S.-Iran war. At the time of writing, spot gold was trading near $4,317.10 an ounce, down 1.90%, while spot silver was trading at $63.500, down 5.46% on the session.
North American equity markets closed lower as oil and yields rose. The S&P 500 fell 44.66 points, or 0.6%, to 7,591.70, the Dow Jones Industrial Average dropped 316.56 points, or 0.6%, to 52,064.10, the Nasdaq Composite lost 171.62 points, or 0.7%, to 26,081.72, and the Russell 2000 fell 30.29 points, or 1.0%, to 2,890.95. European markets also finished lower, with the STOXX Europe 600 down 0.69% to 635.97. London’s FTSE 100 fell 0.57% to 10,608.92, Germany’s DAX dropped 0.84% to 25,361.15, France’s CAC 40 lost 0.49% to 8,116.76, and Italy’s FTSE MIB slipped 0.13% to 51,807.40.
The latest positioning shifted decisively against precious metals after August PPI rose 0.4% on the month and 5.4% from a year earlier, with energy and diesel costs driving the upside. Weekly jobless claims remained low, and the ECB raised its benchmark rate by 25 basis points to 2.50% to counter energy-driven inflation from the Iran war. By the close, Fed-funds futures priced a 71% probability that the Fed raises rates by 25 basis points next week, while the 10-year Treasury yield jumped to 4.943%, its highest settlement since October 2023. Friday’s CPI report is now the final major macro input before the Sept. 15-16 Fed meeting. For gold, the signal is rate-negative: unless CPI cools enough to challenge the hike trade, higher yields and a firmer dollar keep the opportunity cost of holding bullion elevated.
Precious metals traded as part of the inflation-and-yield shock rather than as clean havens. Gold fell through the $4,341.10 200-day EMA reference and tested the $4,315.78 nearest-support area from the latest technical grid. Silver’s damage was heavier, with the metal losing the $67.25 to $68.17 retracement zone, the $65.60 minor 50% level and the $63.31 main swing level before stabilizing near $63.50. The move leaves silver below its prior breakout structure and puts gold at risk of a deeper test unless CPI reverses the rates impulse Friday.
The Strait of Hormuz remains the main geopolitical channel into oil, inflation expectations and defensive demand, but Thursday’s market impact came through crude and yields rather than a sustained bullion bid. Oil futures posted their steepest gains in nearly 2 months as tanker attacks intensified around Hormuz and Houthi forces seized Yemen’s port of Mocha, increasing risk to Red Sea traffic. WTI settled up 6.7% at $102.48 a barrel, and Brent gained 6.3% to $107.63, the highest closes for both benchmarks since May 19. For gold, the setup remains conflicted: Hormuz risk supports defensive demand, but crude above $100 is pushing inflation expectations and bond yields higher, strengthening the case for another Fed hike.
The key outside markets see Nymex WTI crude oil prices firmer and trading around $102.48 a barrel, while Brent crude was near $107.63. The yield on the benchmark 10-year U.S. Treasury note is trading near 4.94%. The U.S. dollar index is firmer after the PPI report. (Kitco Global Index shows how much of today's gold move is the dollar versus the gold market itself.)
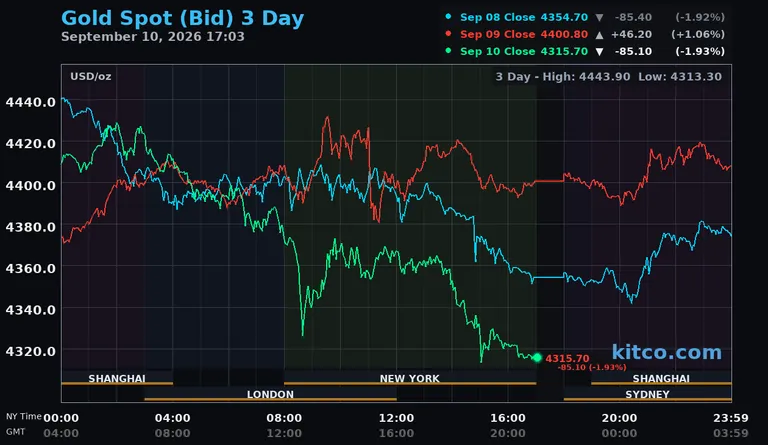
Technically, spot gold bulls' next upside price objective is to push prices back above the $4,379.38 resistance level, with a sustained move targeting $4,396.30 and then $4,500.00. Bears' next near-term downside price objective is a break below $4,315.78, with deeper downside targets at $4,290.00 and then $4,263.00. First resistance is seen at $4,379.38 and then at $4,396.30. First support is seen at $4,315.78 and then at $4,290.00.
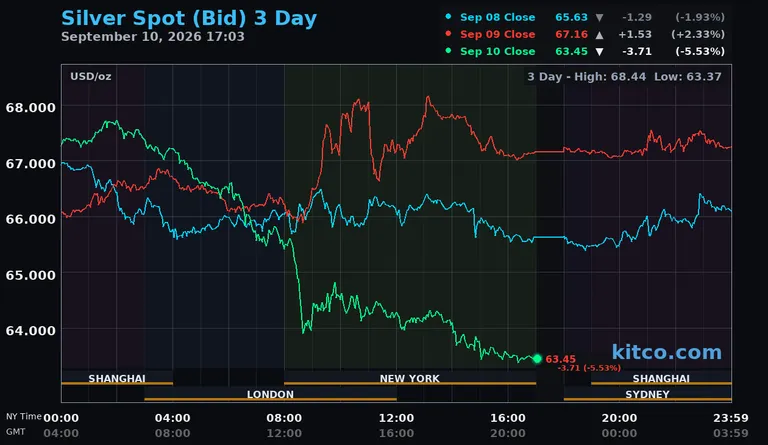
Spot silver bulls’ next upside price objective is to drive prices back above $65.60, with a move above that level targeting $67.25 and then $68.17. The next downside price objective for the bears is a break below $63.31, with deeper downside targets at $62.57 and then $62.56. First resistance is seen at $65.60 and then at $67.25. Next support is seen at $63.31 and then at $62.57.
See live precious metals prices for gold, silver, platinum and palladium — in USD, CAD and 12 more currencies.

