(Kitco Commentary) - In an article on Kitco posted July 22, I highlighted that a medium-term bottom in gold was likely at around $4000, but there was doubt as to whether price would move back to the all-time high. A sideways grind was firmly on the radar. The grind is clearly playing out.
That said;
Meanwhile, in another article, posted July 8, I wrote that "periods of gold weakness driven by expectations of higher interest rates have historically presented attractive long-term buying opportunities." And in my opinion, we are now still in one of those periods.
For context, the last time 10-year Treasuries yielded 5.25%, the gold price was less than $400.00 per ounce, 10x less than today - an absolutely condemning perspective on the long-term viability of fiat currency, and some of the clearest evidence of gold's role as a store of value.
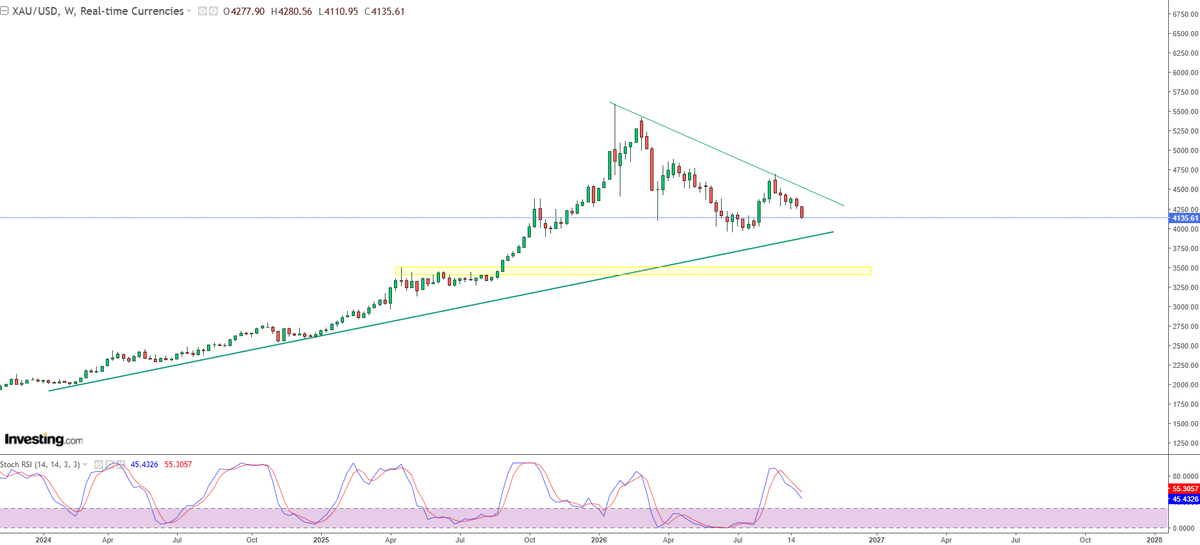
But where does that leave us as far as the medium term? Probably, farther down. The weekly chart below shows trendlines easily interpretable from 25 feet away from your screen. A breach of the bottom rising trendline would likely trigger an avalanche of selling down toward the 3600 level highlighted by the yellow box, which would also likely clear lingering, persistent bullish sentiment.
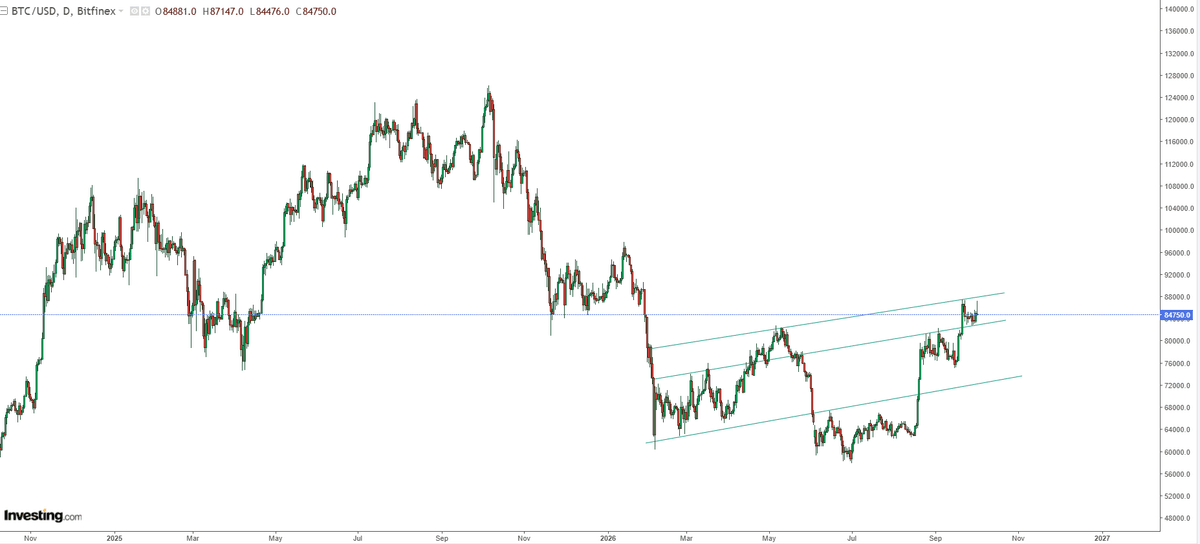
 If you've followed me over the years you're no stranger to my Bitcoin bias; it's multi faceted and one of those facets captures the debasement trade. I had alerted readers during the 2023 basing period that a move to new all time highs was likely. I think the same type of scenario is playing out. It seems to me like BTC is trying to put in a nice long term inverse head and shoulders pattern. Participants will want to watch closely as it develops and likely engage at any convincing breach of the neckline.