
(Kitco News) - Gold prices are sharply down in midday U.S. trading Wednesday, following another cool U.S. price inflation report. Profit-taking is featured from the shorter-term futures traders, on a “buy the rumor, sell the fact” scenario after this week’s tame U.S. inflation numbers were already expected beforehand by traders. December gold was last down $29.10 at $2,478.70. September silver was down $0.446 at $27.335.
The U.S. data point of the day Wednesday saw the consumer price index for July come in at up 0.2% from June and up 2.9%, year-on-year. The core rate was up 0.2% from June and up 3.2%, year-on-year. Those numbers were in line to slightly lower than market expectations. Tuesday’s July producer price index came in at up 0.1%. Excluding food and energy, the “core” PPI was unchanged from June versus. This week’s tame inflation numbers fell into the camp of the U.S. monetary policy doves, who want to see the Federal Reserve cut U.S. interest rates sooner rather than later. The marketplace is presently pricing in a 0.5% rate cut from the Fed at its September FOMC meeting.
The retail sales report on Thursday will also be closely scrutinized by the marketplace.
The gold market this week had seen some modest safe-have demand that pushed the yellow metal to near its record highs. The marketplace is expecting tensions in the Middle East to rise, as Iran and/or its proxies are expected to retaliate militarily against Israel after Israel assassinated Hezbollah and Hamas officials a couple weeks ago.
The key outside markets today see the U.S. dollar index slightly down. Nymex crude oil prices are lower and are trading around $77.50 a barrel. The benchmark 10-year U.S. Treasury note is presently fetching around 3.8%.
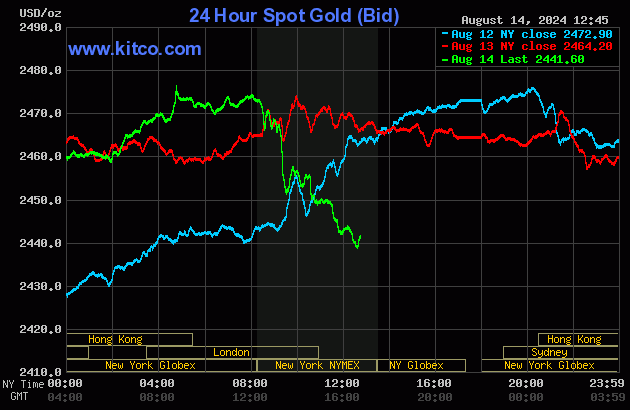
Technically, December gold bulls have the firm overall near-term technical advantage. However, there are stiff overhead chart resistance levels just above present prices. Bulls’ next upside price objective is to produce a close above solid resistance at the contract high of $2,537.70. Bears' next near-term downside price objective is pushing futures prices below solid technical support at $2,400.00. First resistance is seen at $2,500.00 and then at today’s high of $2,519.70. First support is seen at $2,475.00 and then at this week’s low of $2,462.70. Wyckoff's Market Rating: 7.0.
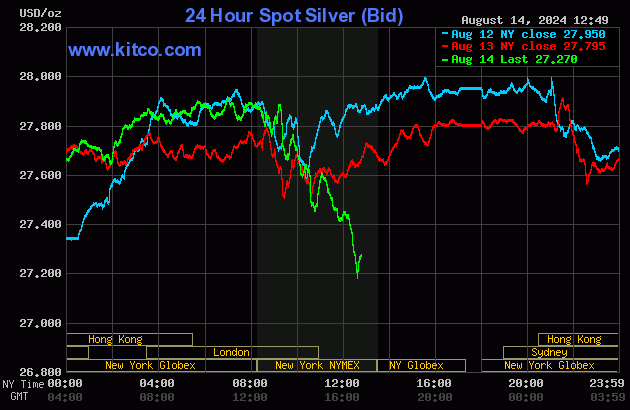
September silver futures bears have the overall near-term technical advantage. Prices are in a 2.5-month-old downtrend on the daily bar chart. Silver bulls' next upside price objective is closing prices above solid technical resistance at the August high of $29.355. The next downside price objective for the bears is closing prices below solid support at $26.00. First resistance is seen at today’s high of $28.175 and then at $28.50. Next support is seen at $27.00 and then at the August low of $26.505. Wyckoff's Market Rating: 4.0.
(Hey! My “Markets Front Burner” weekly email report is my best writing and analysis, I think, because I get to look ahead at the marketplace and do some market price forecasting. Plus, I’ll throw in an educational feature to move you up the ladder of trading/investing success. And it’s free! Sign up here; it’s real easy. https://www.kitco.com/services
