

(Kitco NewsWire) - Spot gold and silver prices were sharply lower after the U.S. close Wednesday, as a stronger-than-expected U.S. PMI print lifted Treasury yields, strengthened the dollar and pushed traders to price a higher probability of another Fed rate hike in October. At the time of writing, spot gold was trading near $4,286.00 an ounce, down 1.63% on the session, while spot silver was trading near $64.330, down 3.88%.
The U.S. equity session closed lower as the bond selloff tightened financial conditions across risk assets. The S&P 500 fell 58.61 points, or 0.8%, to 7,706.03. The Dow Jones Industrial Average lost 352.10 points, or 0.7%, to 51,511.59. The Nasdaq Composite dropped 308.24 points, or 1.1%, to 26,936.04, while the Russell 2000 fell 51.26 points, or 1.8%, to 2,838.66.
European equities also finished lower as oil rebounded and government bond yields rose. The Stoxx Europe 600 fell 0.37% to 640.39. Germany’s DAX lost 0.66% to 25,410.63, France’s CAC 40 fell 0.39% to 8,123.41 and the U.K. FTSE 100 slipped 0.03% to 10,705.26. The Euro Stoxx 50 declined 0.31% to 6,305.08 and Italy’s FTSE MIB fell 0.21% to 51,987.49.
The latest positioning shift came after the September flash U.S. composite PMI rose to 58.4 from 56.0 in August, the highest reading since July 2021. Manufacturing PMI rose to 57.0 from 53.9 and services PMI increased to 58.7 from 56.5, while input costs rose to 66.4 from 59.9, the strongest reading since October 2022. Fed funds futures moved to price roughly a 66% to 70.9% chance of an October rate hike, up from about 53% earlier in the day. The 10-year Treasury yield jumped to 5.106%, its highest since 2007, while the 2-year yield rose toward 4.90%. The dollar gained against the euro, sterling, yen and Canadian dollar, reinforcing pressure on non-yielding gold. Thursday’s weekly jobless claims at 8:30 a.m. ET and Friday’s durable goods orders and final consumer sentiment reports remain the next data points for rate-sensitive metals traders.
The Strait of Hormuz and U.S.-Iran backdrop turned less constructive for risk assets and more inflationary for the macro trade. Iranian officials signaled that Tehran and Washington remain far apart on terms to end the conflict, while U.S. officials continued to frame diplomacy as possible but unresolved. Brent crude rose back above $103 a barrel and WTI crude traded near $92.60 as traders reassessed Middle East supply risk, diesel tightness and the fading of Tuesday’s diplomacy premium. The oil rebound added to inflation concerns and fed the rise in yields, leaving gold caught between geopolitical support and the higher-rate drag.
The key outside markets see Nymex WTI crude oil prices higher and trading around $92.60 a barrel, while Brent crude was near $103.50. The yield on the benchmark 10-year U.S. Treasury note is trading near the 5.1% area. The U.S. dollar index is firmer. (Kitco Global Index shows how much of today's gold move is the dollar versus the gold market itself.)
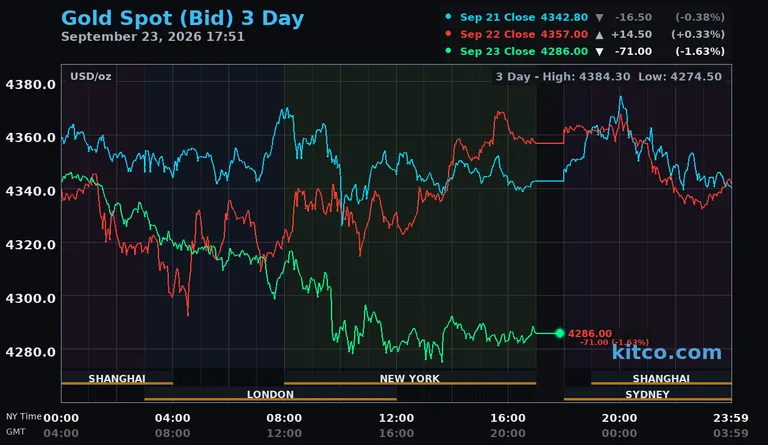
Technically, spot gold bulls’ next upside price objective is to push prices back above the $4,369.00 to $4,400.00 resistance zone, with a sustained move targeting $4,511.00 and then $4,530.00. Bears’ next near-term downside price objective is a break below $4,270.00, with deeper downside targets at $4,235.00 and then the $4,160.00 to $4,180.00 range. First resistance is seen at $4,311.69 and then at $4,343.85. First support is seen at $4,275.00 and then at $4,270.00.
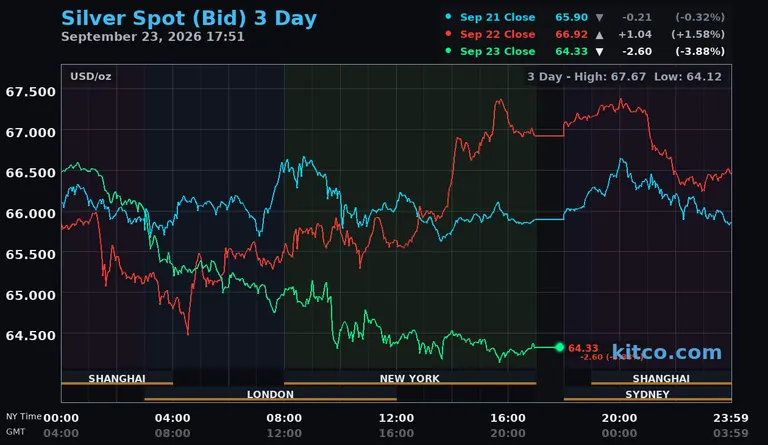
Spot silver bulls’ next upside price objective is to drive prices back above the $66.505 to $68.442 area, with a move above that zone targeting $68.000 and then the $70.000 area. The next downside price objective for the bears is a break below $64.500, with deeper downside targets at the 50-day moving average near $63.430 and then the $61.000 to $62.000 zone. First resistance is seen at $65.463 and then at $66.505. Next support is seen
See live precious metals prices for gold, silver, platinum and palladium — in USD, CAD and 12 more currencies.

