
(Kitco NewsWire) - Spot gold and silver prices were weaker in late U.S. trading Thursday, as elevated Treasury yields, a firmer U.S. dollar and renewed oil-price strength kept pressure on non-yielding metals. At the time of writing, spot gold was trading near $4,274.70 an ounce, down 0.26% on the session, while spot silver was trading near $63.670, down 1.02%.
North American equities finished roughly flat after a volatile session. The S&P 500 fell 1.90 points, or less than 0.1%, to 7,704.13. The Dow Jones Industrial Average fell 161.61 points, or 0.3%, to 51,349.98. The Nasdaq Composite rose 3.34 points, or less than 0.1%, to 26,939.37, while the Russell 2000 lost 3.09 points, or 0.1%, to 2,835.57.
European equities closed lower as rising oil prices and higher bond yields weighed on risk appetite. The Stoxx Europe 600 fell 0.55% to 636.43. Germany’s DAX lost 0.57% to 25,266.53, France’s CAC 40 fell 0.52% to 8,081.43, the U.K. FTSE 100 declined 0.24% to 10,679.99 and Italy’s FTSE MIB dropped 0.85% to 51,543.45.
Market positioning remains tilted toward another Fed rate increase after stronger U.S. activity and housing data reinforced the higher-yields trade. September flash PMIs showed the strongest private-sector growth in more than five years, weekly jobless claims fell to 197,000 and August new-home sales rose 6.4% to a 684,000 annualized pace. Fed funds futures priced roughly a two-thirds to 70% chance of an October rate increase during the session, while the dollar index held near 101 and the 10-year Treasury yield stayed near the 5.1% area. Friday’s August durable goods orders at 8:30 a.m. ET and final September consumer sentiment at 10:00 a.m. ET are the next tests. Stronger orders or firmer inflation expectations would keep gold pinned through yields and the dollar; softer readings would test whether the week’s break below $4,300 has exhausted near-term selling.
The Strait of Hormuz and U.S.-Iran situation remains a direct oil-market shock and an indirect gold-market headwind. Talks produced little visible progress, Iran and the U.S. remained divided over conditions for ending the conflict and Tehran’s proposals still prioritized lifting the U.S. naval blockade on Iranian ports and reopening the strait. Brent crude traded near $105.42 a barrel and WTI near $94.30 in late-day market data, with Brent retaining a larger sea-route premium because international crude is more exposed to Middle East shipping risk. The result is mixed for bullion: the geopolitical backdrop supports safe-haven demand, but higher crude is feeding inflation risk, Treasury yields and Fed tightening expectations.
The key outside markets see Nymex WTI crude oil prices higher and trading near $94.30 a barrel, while Brent crude was near $105.42. The yield on the benchmark 10-year U.S. Treasury note is trading near the 5.1% area. The U.S. dollar index is holding near a two-month high. (Kitco Global Index shows how much of today's gold move is the dollar versus the gold market itself.)
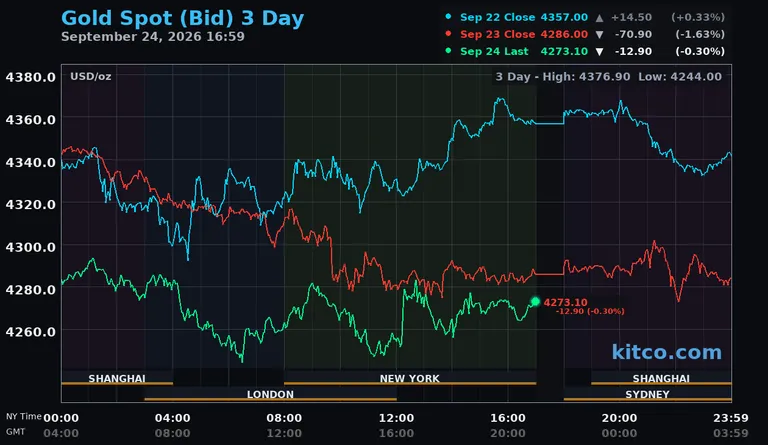
Technically, spot gold bulls’ next upside price objective is to push prices back above the $4,311.00 to $4,347.26 resistance zone, with a sustained move targeting $4,400.00 and then $4,530.00. Bears’ next near-term downside price objective is a break below $4,252.44, with deeper downside targets at $4,160.00 and then the psychologically important $4,000.00 level. First resistance is seen at $4,311.00 and then at $4,347.26. First support is seen at $4,252.44 and then at $4,160.00.
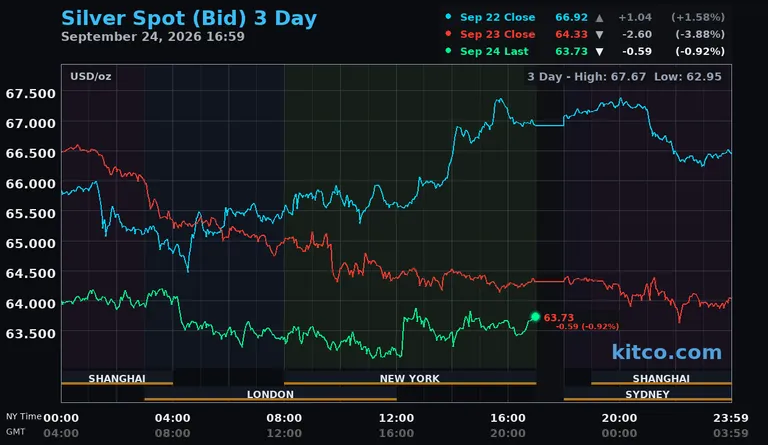
Spot silver bulls’ next upside price objective is to drive prices back above the $65.3565 to $66.4745 area, with a move above that zone targeting $68.000 and then the psychologically important $70.000 area. The next downside price objective for the bears is a break below $63.1920, with deeper downside targets at the $61.000 to $62.000 zone and then $57.000. First resistance is seen at $65.3565 and then at $66.4745. Next support is seen at $63.1920 and then at $62.000.
See live precious metals prices for gold, silver, platinum and palladium — in USD, CAD and 12 more currencies.

