(Kitco News) – While there are several key factors that impact gold and silver prices differently, new demand growth for both precious metals and the paucity of new supply means both are likely to continue increasing in value, according to Erik Norland, Executive Director and Senior Economist at CME Group.
The first gold and silver coins were minted 2600 years ago in the Anatolian Kingdom of Lydia, and this resulted in the earliest known instance of the gold:silver ratio.
“Like any cross rate, the amount of silver that can be purchased with an ounce of gold is driven by both demand and supply-side factors, and the cross rate is anything other than stable,” Norland said. “Sadly, we don’t have the time series of the gold-silver ratio dating back to ancient times, but we do have data going back to the launch of gold futures on December 31, 1974. Since the mid-1970s, one ounce of gold bought anywhere from 17 ounces to as many as 123 ounces of silver.”

Aside from monetary policy, Norland listed four key factors that govern the gold-silver ratio: relative volatility and the silver beta; fabrication demand and technological change; gold’s use as a monetary asset; and Supply-side dynamics.
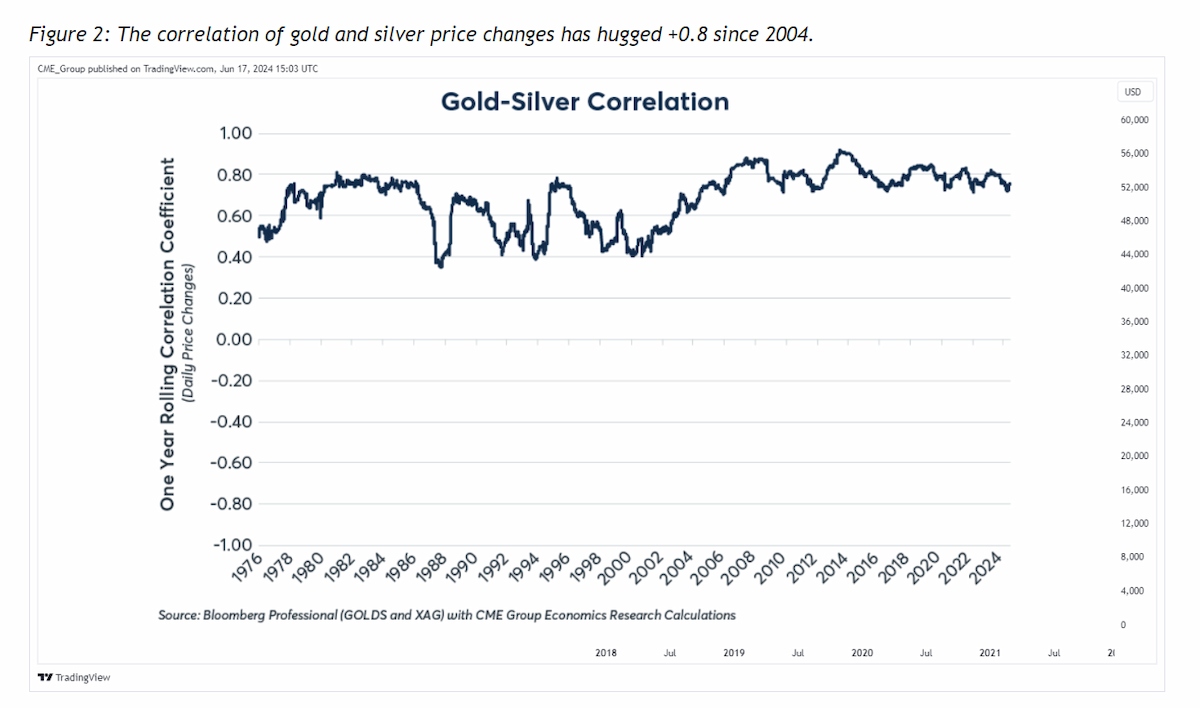
“To borrow an expression from the equity markets, silver is the high-beta version of gold,” Norland said. “First, silver and gold prices usually have a strong positive correlation. Since 2004, the one-year rolling correlation of their daily price moves has hovered around +0.8.”
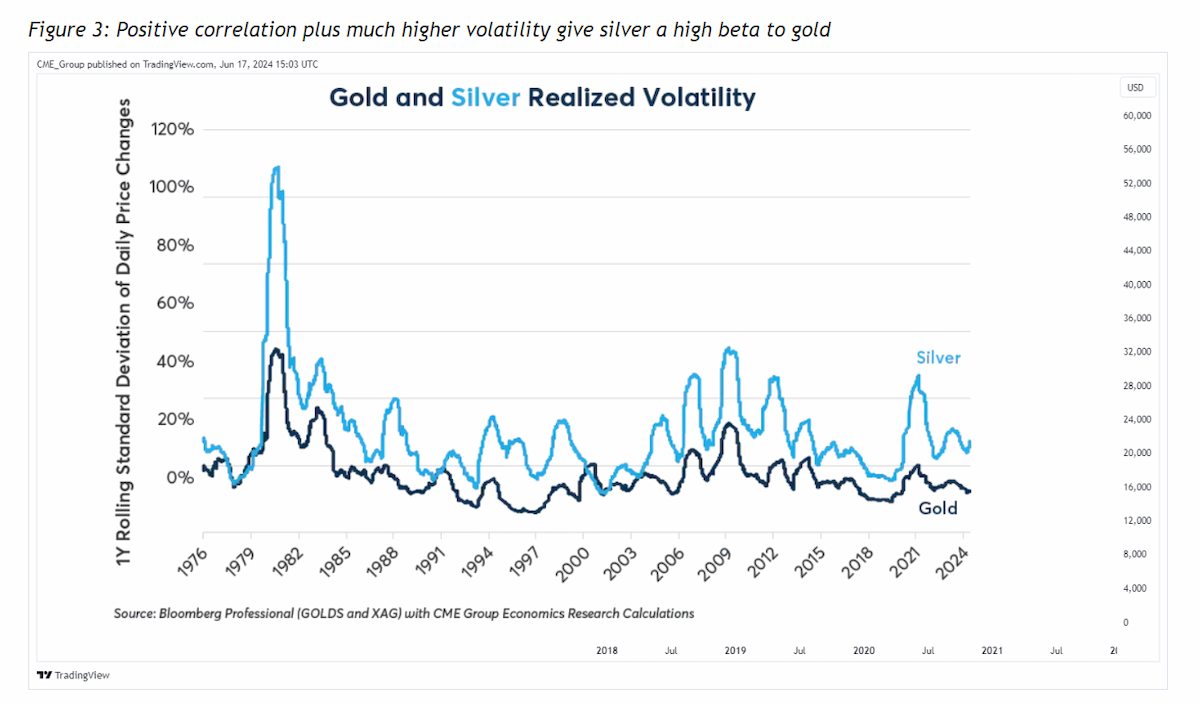
Norland also pointed out that silver is more volatile than gold. “As such, when gold prices move up, silver tends to move up more, thereby lowering the gold-silver price ratio,” he said. “By contrast, during bear markets, the gold-silver ratio tends to rise. For example, when gold and silver prices peaked in September 2011, one ounce of gold bought fewer than 32 ounces of silver. In the ensuing bear market, the ratio rose to as high as 124 ounces of silver per ounce of gold.”
Norland noted that as gold and silver rallied early in the pandemic in 2020, the ratio fell by nearly 50% to 64. “In 2024, as both metals have rallied, silver has outperformed, rising 23% in the first five months of the year compared to 12% for the yellow metal,” he wrote.
The second major factor that impacts the gold:silver ratio is fabrication demand and technological change. “What is curious is that while gold and silver have rallied thus far in 2024, gold broke to new record highs of nearly $2,500 per ounce, whereas silver prices remain 40% below their twin 1980 and 2011 peaks despite having outperformed gold since 2020,” he noted. “The reason may lie in technological advances.”

Norland wrote that well before the first gold and silver coins were minted, both metals were already being used to make jewelry. “Even today, the primary use of both metals is to make jewellery,” he said. “Yet, thus far this century, silver has been buffeted by two sets of technological developments: the digital revolution and the energy transition. Both have impacted the relative gold-silver ratio.”
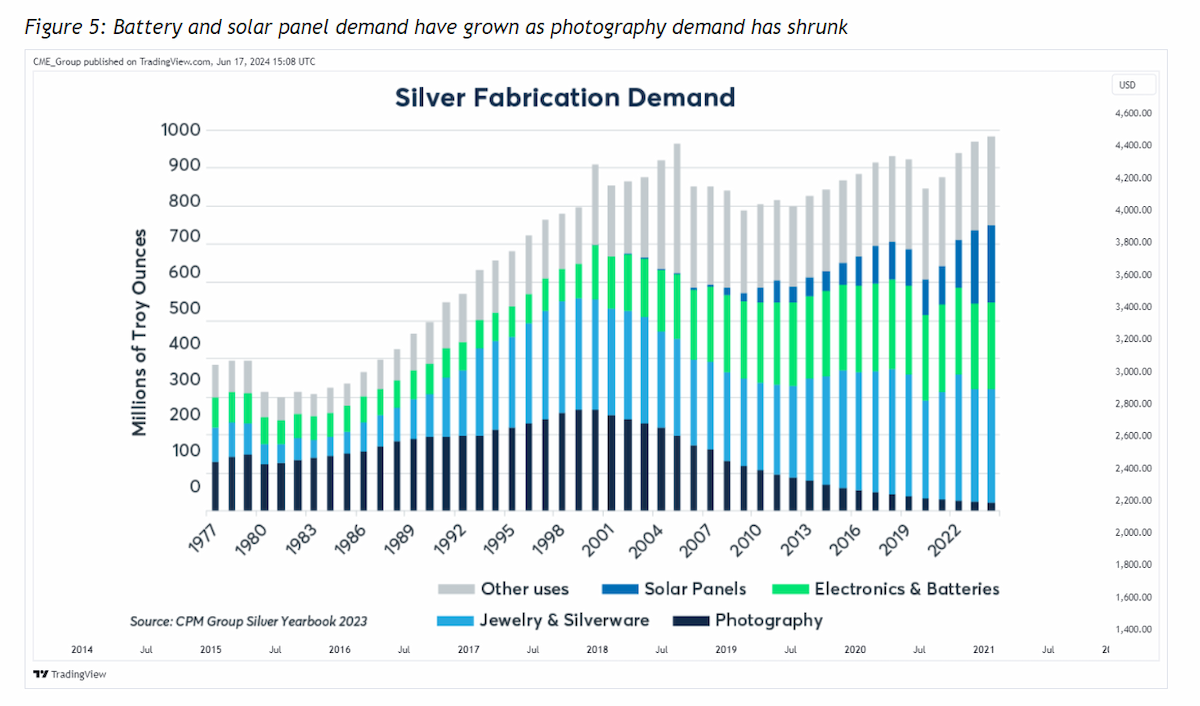
In 1999, photography consumed 36.6% of the year’s silver supply, but by 2023, the rise of digital photography meant the sector used only 2.3% of the annual supply. “Meanwhile, silver’s use in electronics and batteries grew from 90 million ounces to 227.4 million ounces or from 12.3% to 22.7% of silver’s total annual supply, partially offsetting the decline in traditional photography, which may partially explain why silver has struggled to hit new highs in recent years even as gold has set records,” Norland wrote.
“The good news for silver, however, is that it is finding new use in the energy transition,” he added. “Over the past few years silver has seen strong growth coming from solar panels, which accounted for 20% of 2023 silver demand, up from essentially nothing in 1999. Solar panels may explain in part why silver has recovered relative to gold since 2020.”
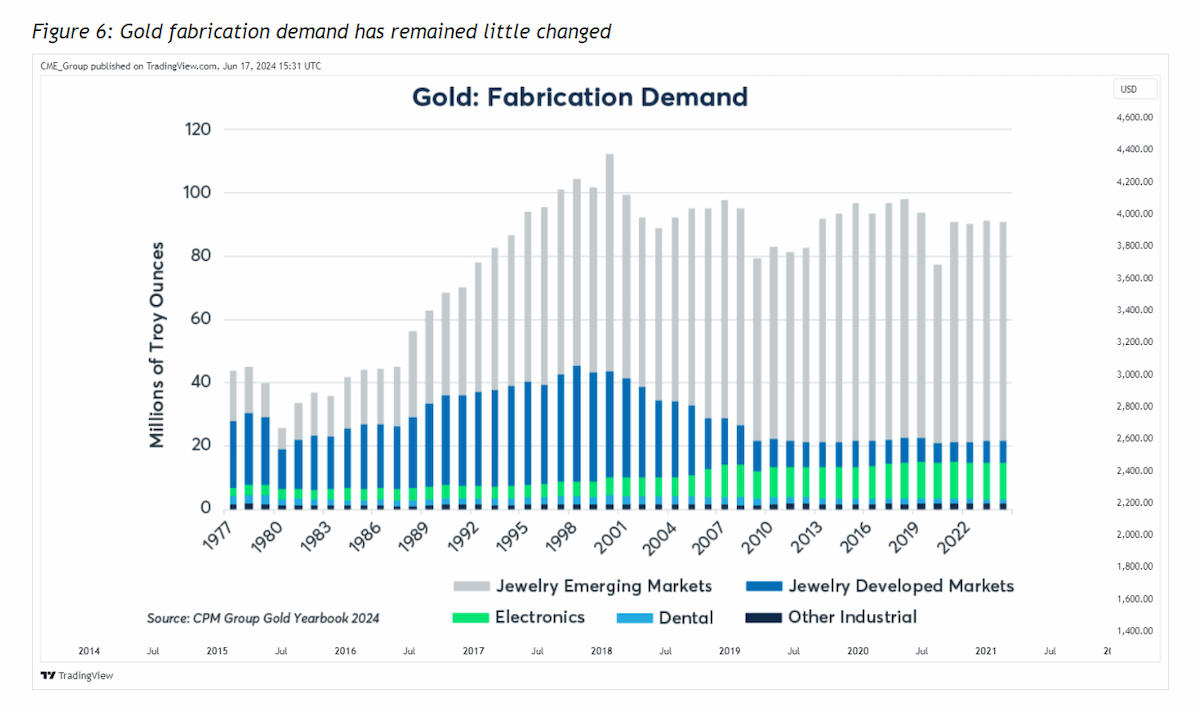
“By contrast, gold fabrication demand has shown itself to be immune from recent technological developments and is still overwhelmingly dominated by jewellery demand, with electronics, dental and other uses absorbing just 17% of annual gold mining supply,” Norland noted. “The differences in silver and gold fabrication demand underscores that gold is considered the purer of the two precious metals.”
Norland pointed out another key difference between the two metals. “[C]entral banks around the world treat gold as money while they largely ignore silver,” he wrote. “They hold a combined 36,700 metric tons of gold, the equivalent of 1.2 billion troy ounces or 13 years of global mining output. Moreover, central banks have been net buyers of gold every year since the global financial crisis.”
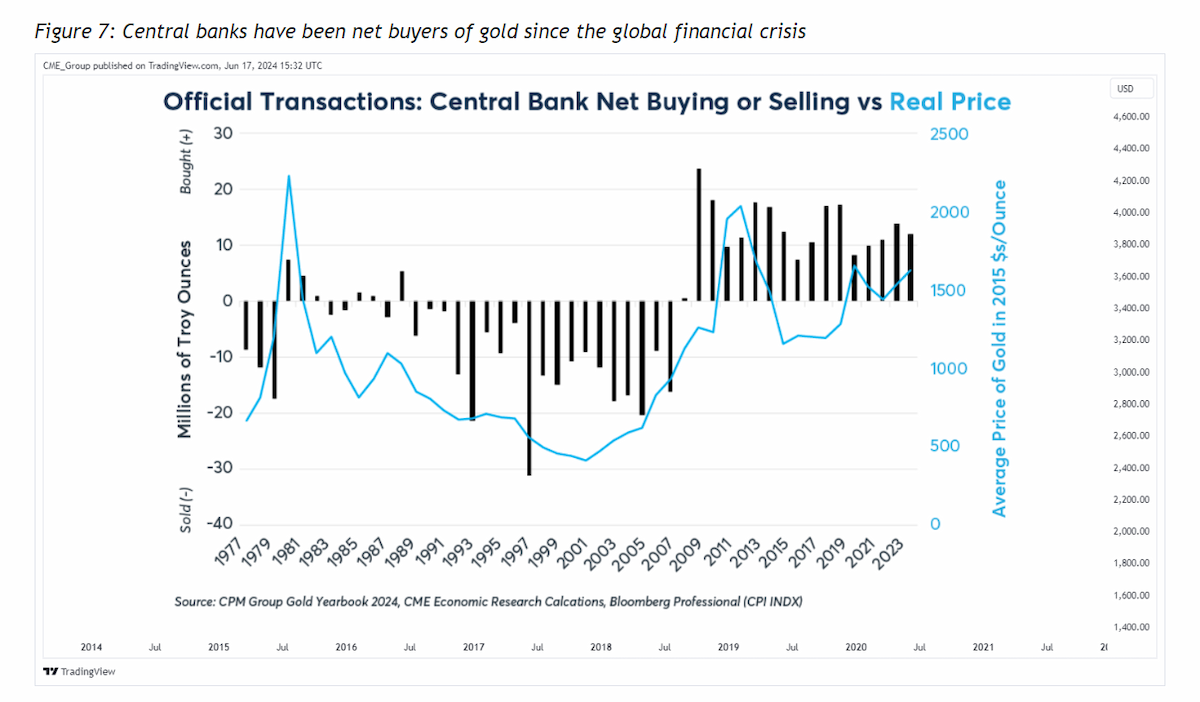
He also pointed out that central banks have been net buyers of gold since 2009, whereas they were net sellers from 1982 to 2007.
“Central banks’ accumulation of gold suggests that they want a hard asset to complement their foreign exchange reserves of dollars, euros, yen, and other fiat currencies, a view that appears to have been reinforced by on-and-off quantitative easing since 2009 and increased use of financial sanctions,” Norland noted. “Central bank buying impacts gold prices directly, but only boosts silver prices indirectly via the gold market.”
The final factor that governs the relative value of the two metals is supply, and here, as well, sovereign buying is having a significant impact, as it reduces the amount of gold available to the public.
“Over the past decade, central bank buying has removed the equivalent of 8%-20% of new mining supply from the gold market each year, which may also explain why the gold-silver ratio rose significantly from 2011 to 2020 and why, even today, it remains at 2x its 2011 level,” Norland wrote.
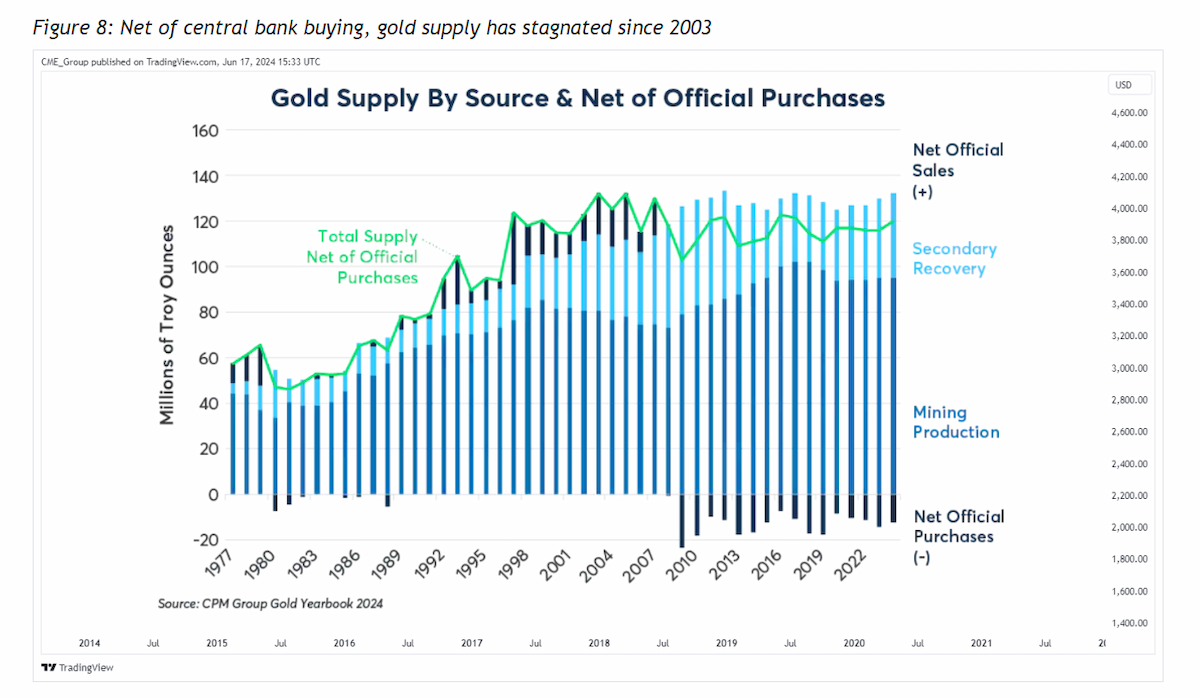
This new demand is running into long-term supply constraints. “Total gold supply net of official purchases has stagnated since 2003,” he said. “Meanwhile, silver mining supply peaked in 2016, and gold mining supply peaked the next year.”
“The fact that new supply is arriving on the market more slowly than in the past may be bullish for both gold and silver,” Norland noted.
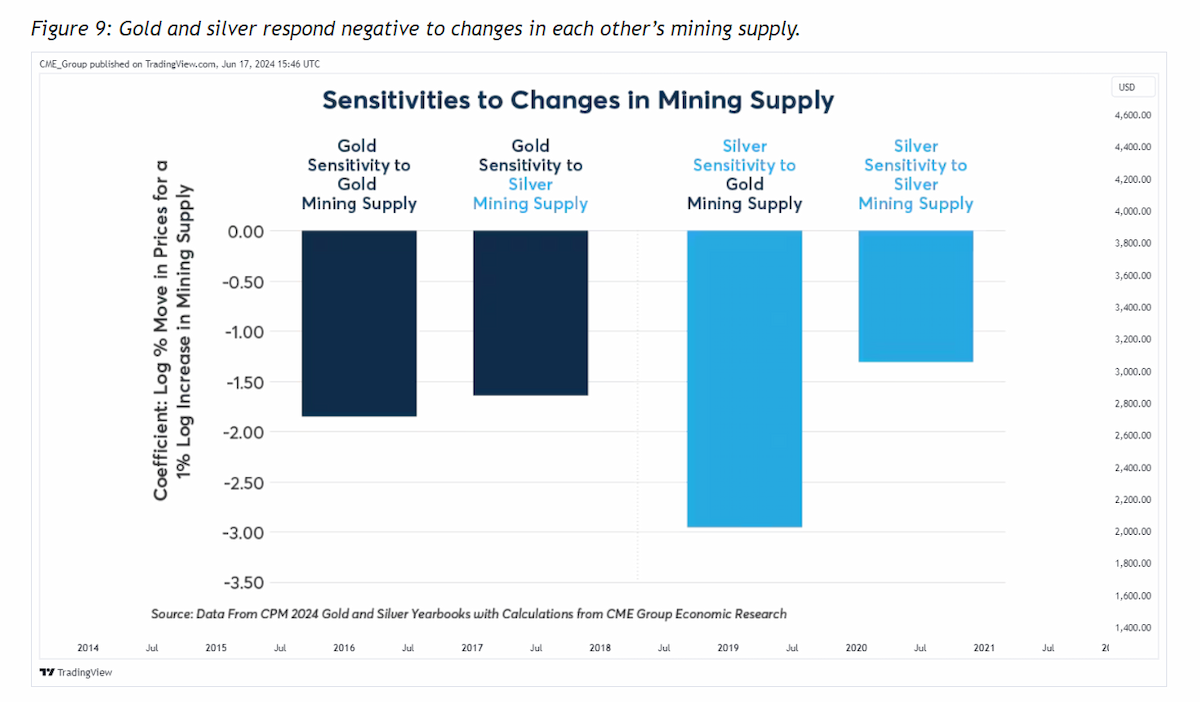
The CME Group’s econometric analysis indicates that gold and silver prices are negatively correlated with changes to one another’s mining supply. “A 1% decrease in gold mining supply, on balance, boosted gold prices by 1.9% and silver by 3.0% from 1974 to 2023,” he wrote. “A 1% decrease in silver mining supply boosted the prices of the metals by 1.3%-1.6%.”
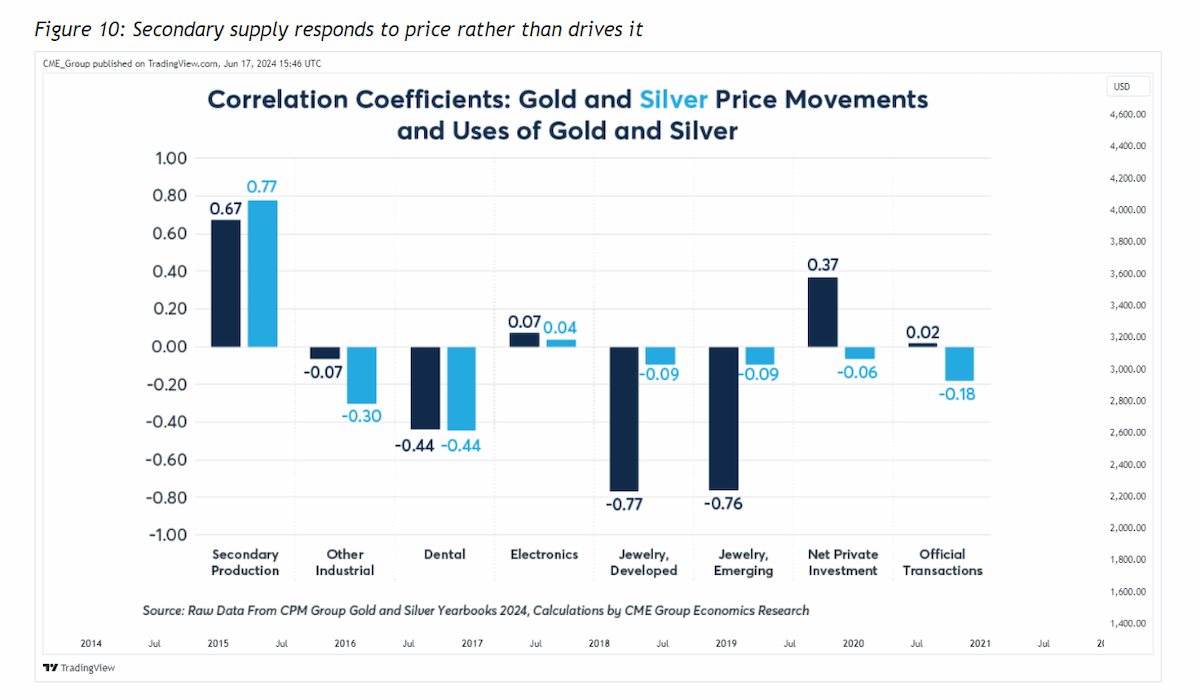
“Secondary supply appears to respond to price rather than drive it,” Norland concluded. “Higher prices incentivize more recycling, but recycled metal doesn’t appear to depress prices as it doesn’t bring any new metal onto the market.”
Despite all the differences in supply, demand, and use, the two metals are connected though jewelry. “Because gold is 70x as costlier than silver when prices rise, demand for gold jewellery falls while silver’s jewellery demand is relatively unresponsive to price because it costs much less,” he added. “Gold and silver can be seen as a sort of binary star system where the two stars orbit a common center of gravity or barycenter. Gold is the larger, more stable and more influential of the two, but it is by no means immune from silver’s pull.”
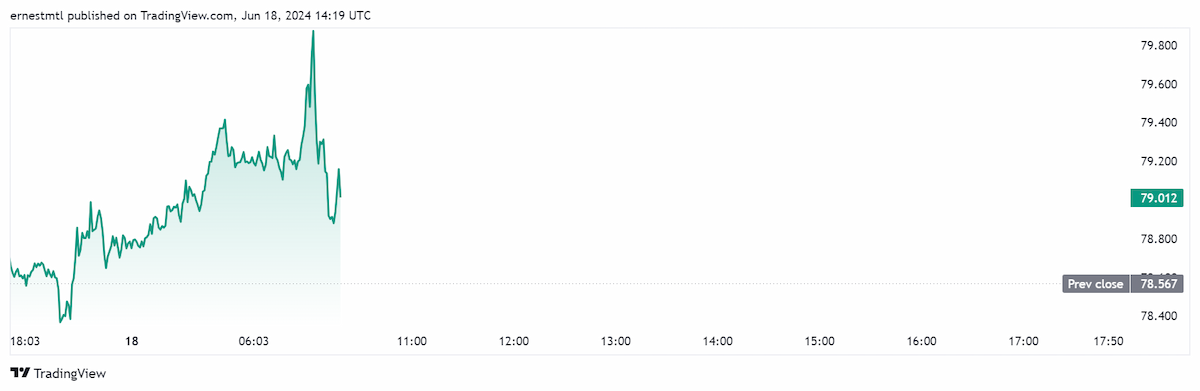
The gold:silver ratio has strengthened in early trading on Tuesday, hitting a high of 79.873 a half-hour after the North American market open. It has since pulled back somewhat, last trading at 79.012 at the time of writing for a gain of 0.57% on the daily chart.