

(Kitco News) – Friday was a relatively quiet day in financial markets, especially compared to the fireworks that took place earlier in the week. Cryptocurrencies largely consolidated while stocks saw volatility in the morning session before finishing higher in the afternoon.
“U.S. markets rebounded Thursday, with the S&P 500 notching its best day since November 2022, and the tech-heavy Nasdaq 100 climbing 3.1%,” said analysts at Secure Digital Markets. “Traders are hustling to regain market momentum following Monday’s sharp global sell-off, triggered by disappointing U.S. payroll data, anxiety over the Federal Reserve’s rate-cut plans, and the unwinding of the Japanese yen carry trade.”
While Friday saw a minimal extension of Thursday’s gains, investors remain on edge as “the S&P 500 and Nasdaq are tracking for their fourth consecutive losing week,” the analysts noted.
At the closing bell, the S&P, Dow, and Nasdaq all finished higher, up 0.47%, 0.13%, and 0.51%, respectively. Spot gold battled back from early pressure, trading up 0.27% at the time of writing, while silver was essentially flat on the day.
Bitcoin (BTC) “ripped through resistance, skyrocketing to nearly $63,000 in a stunning market rally that clawed back steep losses from earlier in the week,” Secure Digital Markets said. “Early birds who bought the dip seem to have called it right, viewing the recent pullback as nothing more than a healthy correction.”
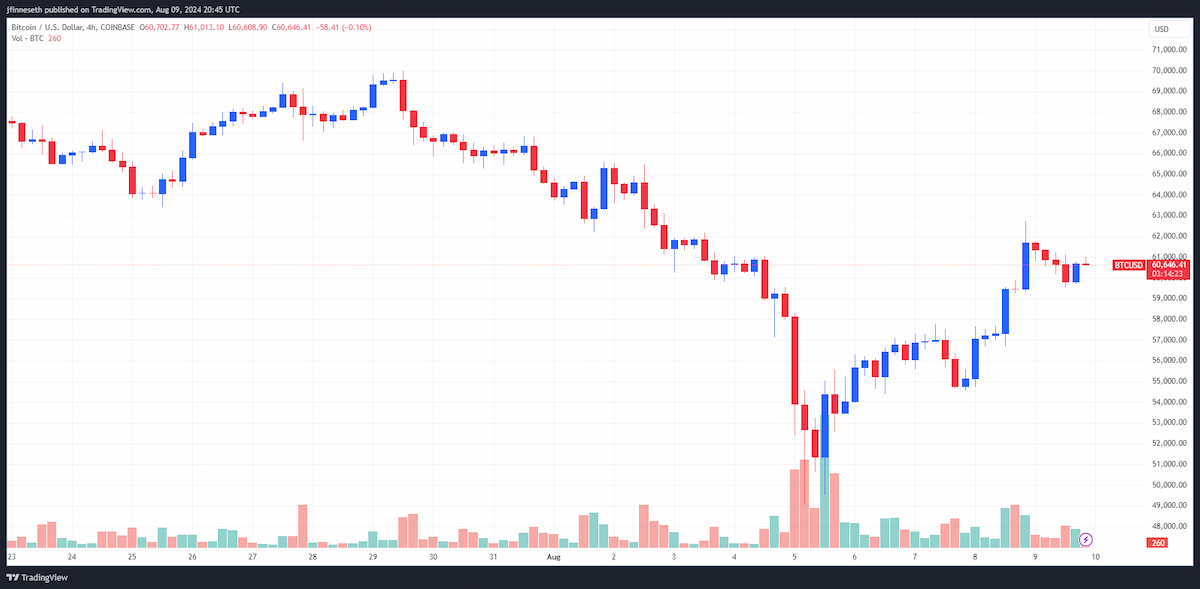
BTC/USD 4-hour chart by TradingView
On Friday, Bitcoin consolidated below $62,000, and at the time of writing, BTC trades at $60,680 for an increase of 1.73% on the 24-hour chart.
Bear v. bull battle rages
Following Bitcoin’s flash crash below $50,000 on Monday, market analysts are at odds on what to expect moving forward, with some calling the drawdown and reversal a bear trap, while others think it hints at a future pullback to support at $40,000.
So, that was a shake-out or a Bear trap ? pic.twitter.com/ezTFDIiabI
— Sensei (@SenseiBR_btc) August 8, 2024
“Weekly time frame is bearish right now,” market analyst DonAlt said in a recent YouTube update. “And it will remain bearish unless we reclaim $60,000…I think $60,000 is now the line in the sand.”
While Bitcoin is currently trading above $60,000, DonAlt said it needs a weekly close above the level to confirm it as support and overrule his bearish outlook. That said, he noted that Bitcoin’s ability to hold support at $52,000 was a positive sign.

BTC/USD 1-week chart by TradingView
“We did hit support this time, in my opinion,” he said. “It’s not the best – the really good support is down here [just below $44,000]. But we did hit it. We had a massive massive washout which, in my opinion, we didn’t really get too much of in the last dip [in early July], which is bullish, right?”
DonAlt warned to be on the lookout for a revisit of support at $52k in the coming days.
“If we start straight up going down [below $52,000] in next few days… I would be surprised,” he said. “We can easily retest the lows, but I think there’s a good chance that the $50,000s are going to be where we’re trading around. Unless something catastrophic happens in macroland.”
But according to MN Trading founder Michaël van de Poppe, as long as Bitcoin closes the weekly candle above $57,000, then it is likely that the bottom is in.
#Bitcoin is printing a massive weekly candle.
If this closes above $57k, then it's very likely that we've seen the low of this correction. pic.twitter.com/JPzSzyCWb6— Michaël van de Poppe (@CryptoMichNL) August 8, 2024
“I'd prefer to see it hold above $57.5K,” he said in a follow-up tweet. “As long as that happens, I'm expecting bullish continuation to be taking place towards an all-time high in September/October.”
TradingView analyst TradingShot found a correlation between Bitcoin and the gold/Russel 2000 ratio that validates van de Poppe’s outlook and suggests that a parabolic run for Bitcoin is approaching.
“Bitcoin is under heavy pressure lately, basically it has paused for the past 5 months the uptrend that started in late 2022,” he said. “We have discovered a remarkable correlation with Gold (XAUUSD) and Russell 2000 (RUT) in the form of the GOLD/RUT ratio (blue trend-line). This correlation, which is a negative one (i.e. when BTC rises the GOLD/RUT ratio falls and vice versa), is present on a cyclical basis.”
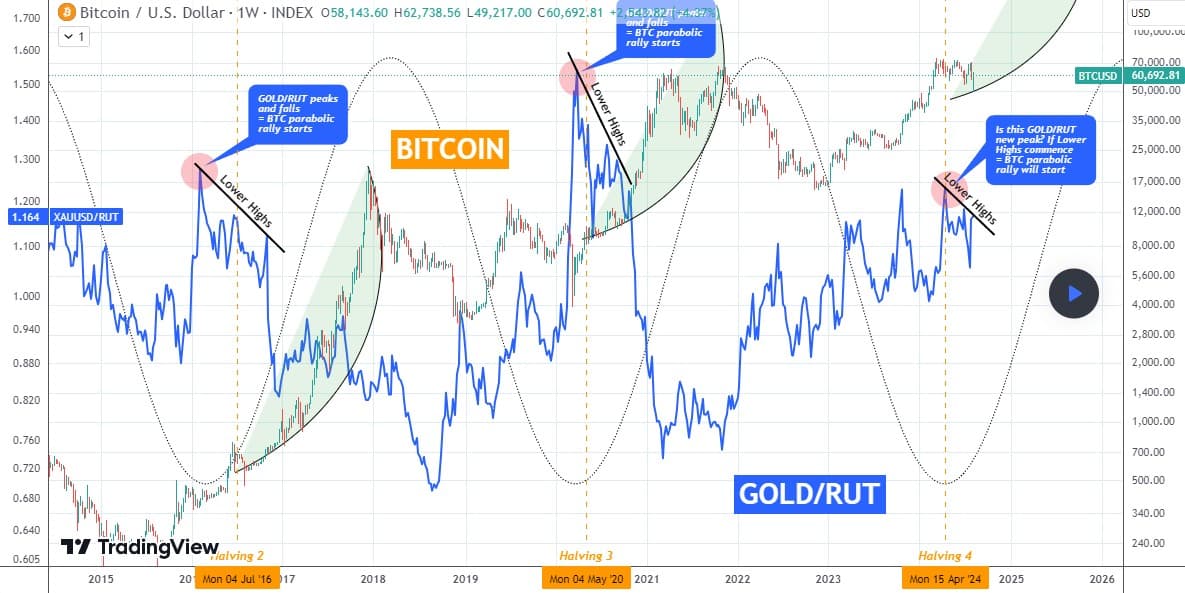
“When the GOLD/RUT ratio peaks and starts falling by forming Lower Highs, Bitcoin tends to start its parabolic rally (green arc) of the Bull Cycle, above previous All Time Highs,” TradingShot explained. “This usually takes place a little before the Halving.”
“Right now it appears that it happened on the last Halving (mid-April), assuming we see the ratio forming Lower Highs from now on,” he said. “If it does, BTC will most likely start the most aggressive part of the Bull Cycle. The Sine Waves that track the GOLD/RUT peak, suggest that indeed the April High may have been the new peak. It remains to be seen if Lower Highs will be formed.”
And market analyst Moustache pointed to a development with USDT dominance that suggests the next bull run could soon begin.
#Altcoins
2 days until the weekly candle of the USDT Dominance closes.
This shooting star candle would be the most bearish candle in years + a 3-year uptrend was broken and bearishly retested.
USDT.D down = $BTC and Altcoins up.
Are we finally getting THE bull run??? pic.twitter.com/nkalV3MTzd— ???????ⓗ? ? (@el_crypto_prof) August 9, 2024
At the time of writing, Bitcoin trades at $60,703, an increase of 1.83% on the 24-hour chart.
Mixed finish to the week for altcoins
Friday was a mixed day of trading for altcoins, with the majority of tokens in the top 200 seeing green.
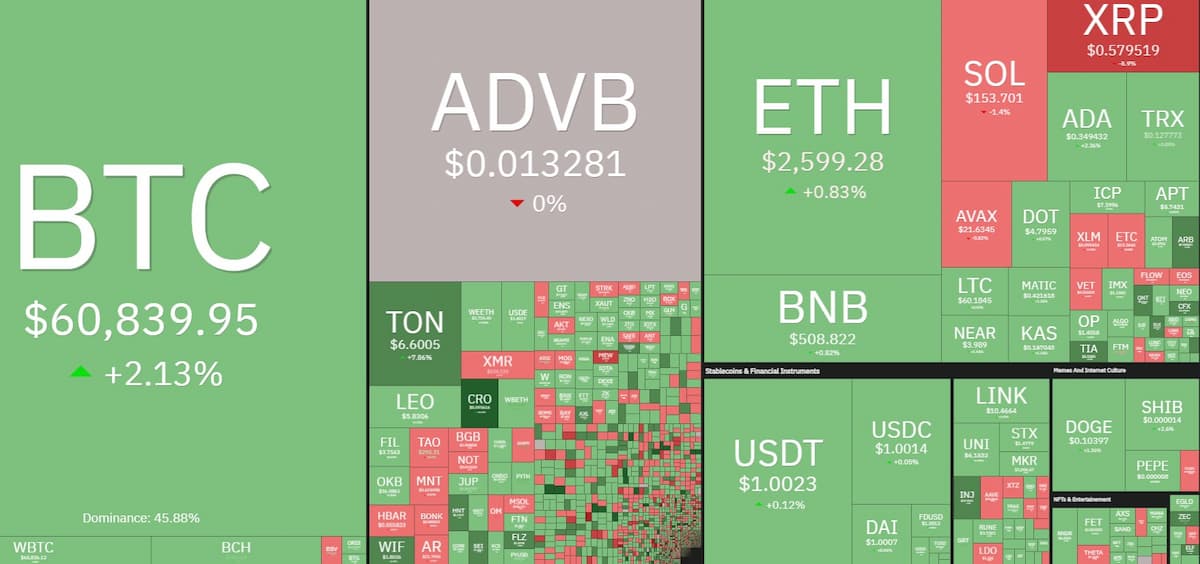
Daily cryptocurrency market performance. Source: Coin360
Celestia (TIA), Cronos (CRO), and Zcash (ZEC) led the gainers with increases of 16.6%, 16.3%, and 16.1%, respectively. Meme token cat in a dogs world (MEW) fell 7% to lead the losers, followed by a decline of 6.9% for Galxe (GAL), and a loss of 6.5% for XRP (XRP).
The overall cryptocurrency market cap now stands at $2.11 trillion, and Bitcoin’s dominance rate is 56.6%.