
(Kitco News) – Stocks, gold, and crypto all trended into the red to start September – a month that is notoriously bad for asset prices – as traders await the first interest rate cut from the Fed, several key data points that could impact the trajectory of potential cuts, and a countdown to the U.S. Presidential election in November.
“The S&P 500 opened 0.7% lower today, following a strong week that brought it near its all-time high,” said analysts at Secure Digital Markets. “Other major indices like the Dow Jones and the Nasdaq also dropped by 0.4% and 1.1%, respectively, this morning.”
“In the bond market, Treasury yields declined ahead of an anticipated report on U.S. manufacturing, one of the economic sectors most affected by high interest rates and which has been contracting for nearly two years,” they added.
“Concerns over a slowing U.S. economy triggered a sharp decline in stocks earlier this summer, but markets have since recovered on hopes that the Federal Reserve could engineer a soft landing,” the analysts noted. “After raising its main interest rate to a two-decade high to curb inflation, the Fed is expected to ease rates later this month in an effort to prevent a recession.”
The stock market’s rough start to September was underlined by Nvidia (NVDA), which fell more than 9.5% on Tuesday as investors continued to withdraw following a lackluster earnings report and lingering questions about the future of the AI trade.
At the close of markets, the major indices were all deep in the red, with the S&P, Dow, and Nasdaq finishing down 2.12%, 1.51%, and 3.26%, respectively.
“Coming into Labor Day weekend, Bitcoin (BTC) experienced a gradual increase, climbing from $57,380 to $59,810—a gain of approximately 4.2%,” noted analysts at Secure Digital Markets. “However, this uptick marked a short-term peak as, following yesterday’s daily close around 7 PM EST, the market evidently encountered resistance it could not overtake, leading to a sharp drop of over $1,500 down to $57,750 this morning.”
“The recent bullish momentum has diminished, and traders will now be closely monitoring whether the intraday support at $57,800 can hold,” they added. “Ethereum (ETH) also follows suit, closely following BTC’s movements, and seems bound to test its local support at $2,400.”
Data provided by TradingView shows that Bitcoin hit a high of $59,840 in the early hours on Tuesday, but an afternoon sell-off dropped it back to support at $57,500.
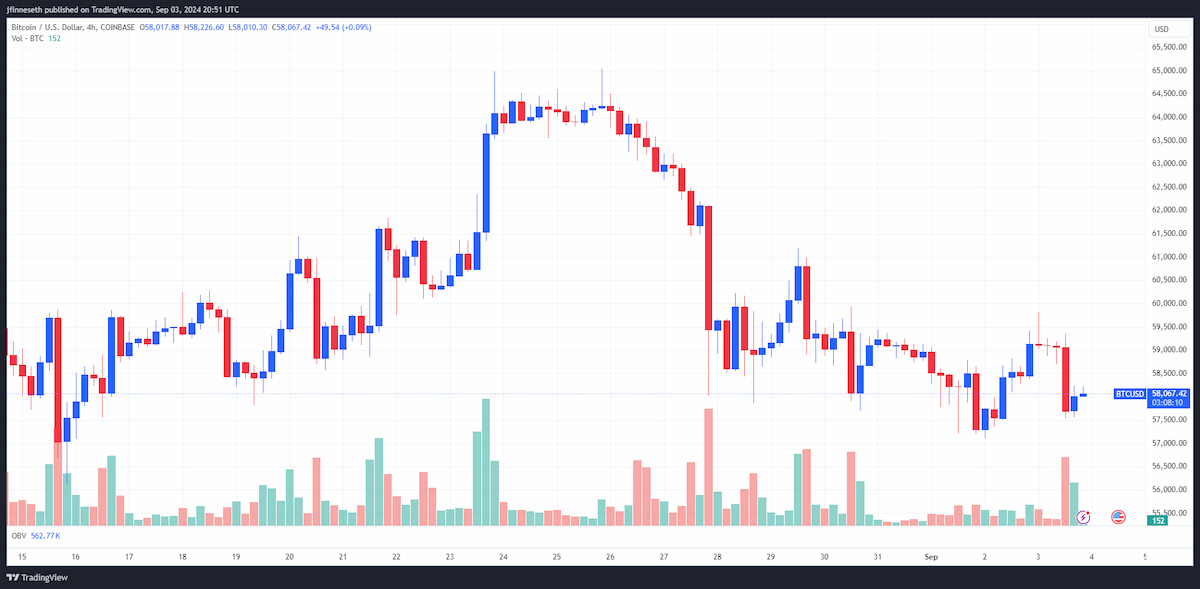
BTC/USD Chart by TradingView
Bulls have since pushed the price action, and at the time of writing, BTC trades at $58,202 for a loss of 1.48% on the 24-hour chart. Spot gold is currently down 0.25% and trades at $2,492.80 per ounce.
Echoes of past cycles
The day-to-day chop of post-halving Bitcoin markets challenges the fortitude of even the most seasoned crypto traders, highlighting the need to take a step back to get a big-picture view to see that things have largely progressed as they did in previous cycles.
“Bitcoin has been following very closely the structural patterns of past Cycles,” noted TradingView analyst TradingShot, who provided an analysis “on the similarity sequences with cyclical fractals.”
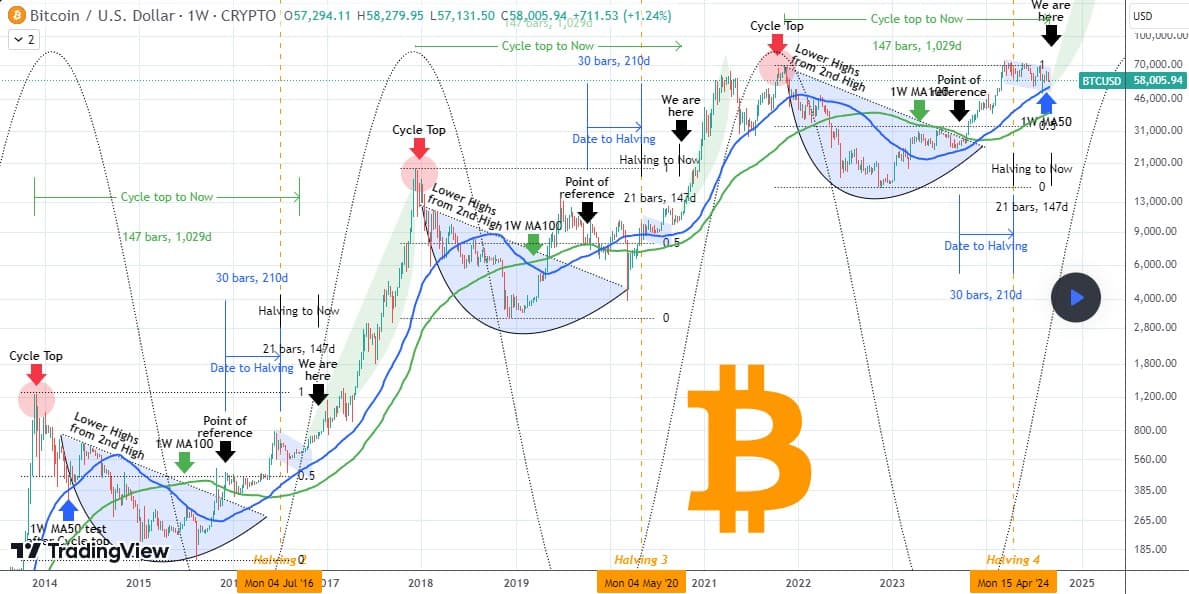
“As you can see, BTC followed the exact path we plotted and did what was expected by breaking above the 1W MA100 (green trend-line),” TradingShot said. “With the price basically consolidating for the past 6 months (Bull Flag/Channel Down), it is time to revisit this successful chart and see what lies next.”
“With some modifications, we can see that after successfully holding the 1W MA50 on the early August test, the price should (relative to the past 2 Cycles) start the new Parabolic Rally (green Arc),” he said. “We are 147 weeks (1029 days) from the previous Cycle Top and 21 weeks (147 days) since the Halving. In past Cycles, that was the exact point ('we are here') where Bitcoin initiated the aggressive rise.”
“In all cases, the 1W MA50 held, so that is the market's goal now, to keep it intact so that buyers don't lose the psychological Support level,” he concluded. “If it holds, breaking above the 100k should be a minimum expectation, especially ahead of this month's start of an Interest Rate Cut Cycle and the U.S. elections (traditionally markets are bullish post event) in November.”
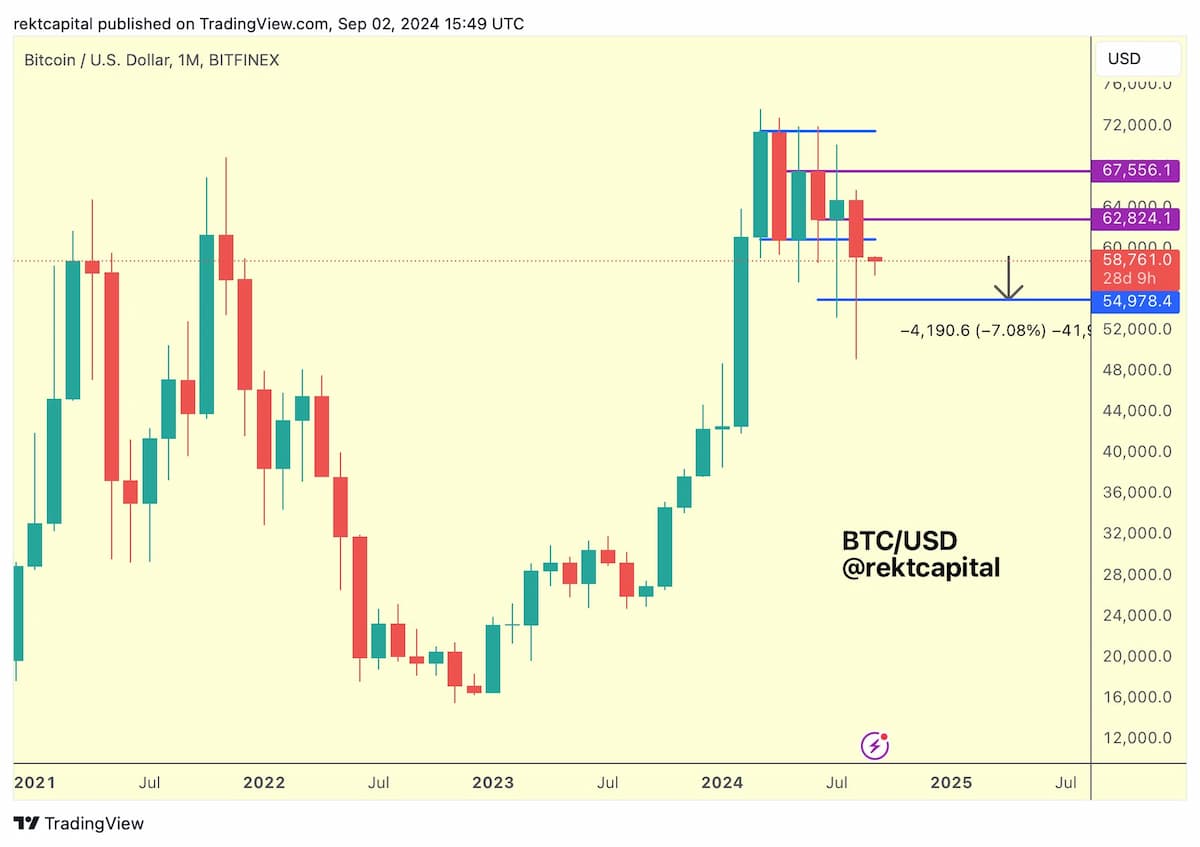
As for what to expect in the near term, market analyst Rekt Capital noted that September has historically been a negative month for Bitcoin.
Single-digit #BTC downside in September happens 54% of the time
Single-digit upside in September happens 27% of the time
Double digit downside in September happens 18% of the time (but deep double-digit downside occurred in a Bear Market)$BTC #Crypto #Bitcoin pic.twitter.com/qWFMbE7S83— Rekt Capital (@rektcapital) September 3, 2024
“If Bitcoin were to produce the historically recurring -7% drawdown during this September as well… That would mean Bitcoin would drop into ~$55,000 again,” Rekt Capital warned.
Altcoins follow Bitcoin lower
Altcoins largely traded in the red on Tuesday, with only two dozen tokens in the top 200 recording gains on the day.
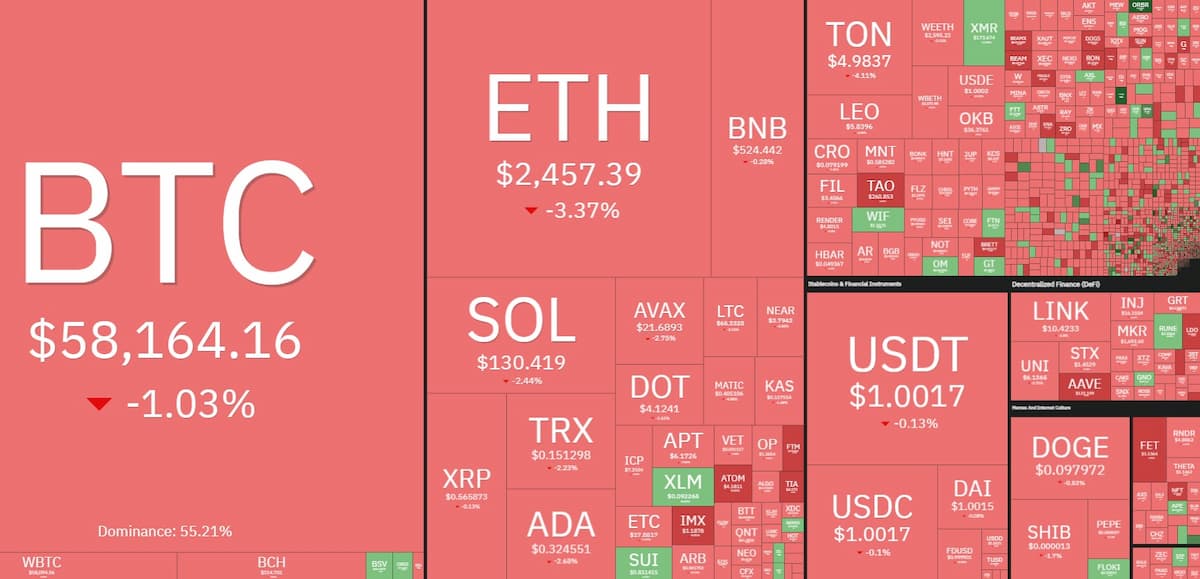
Daily cryptocurrency market performance. Source: Coin360
Flux (FLUX) overcame the noise to gain 18.6%, followed by increases of 6.9% and 5.7% for UMA (UMA) and Sui (SUI). LayerZero (ZRO) saw the largest decline, falling 9.3%, while DOGS (DOGS) lost 8.4%, and Pendle (PENDLE) fell 7%.
The overall cryptocurrency market cap now stands at $2.04 trillion, and Bitcoin’s dominance rate is 56.4%.