

(Kitco News) – Gold once again proved its worth as a store of value as stocks and crypto saw declines on Thursday, while the yellow metal rose above concerns about inflation and interest rates to record a gain of 0.85% and trade at $2,629.90/oz in the spot market.
“The broader risk asset environment, encompassing cryptocurrencies and equities, has been under pressure following economic indicators that suggest persistent inflation and a rise in unemployment rates,” noted analysts at Secure Digital Markets.
“The Consumer Price Index for September increased by 2.4% year-over-year, exceeding the forecasts of 2.3%,” they said. “This has shifted market expectations, raising the likelihood of a 25 basis point rate cut in November to 86% from 80% just the previous day, with expectations for a December cut also climbing to 88% from 79%. The chances for a significant 75 basis point reduction by the end of the year have plummeted to zero from 45% last week, signaling that the hotter-than-anticipated inflation may bolster arguments against further rate reductions.”
The odds of no rate cut in November have also risen, with the CME FedWatch Tool showing the chances of the Fed holding rates steady next month stand at 17%.
In response to the threat against easy money policies, risk assets wavered, with the S&P, Dow, and Nasdaq closing the day down 0.21%, 0.14%, and 0.05%, respectively.
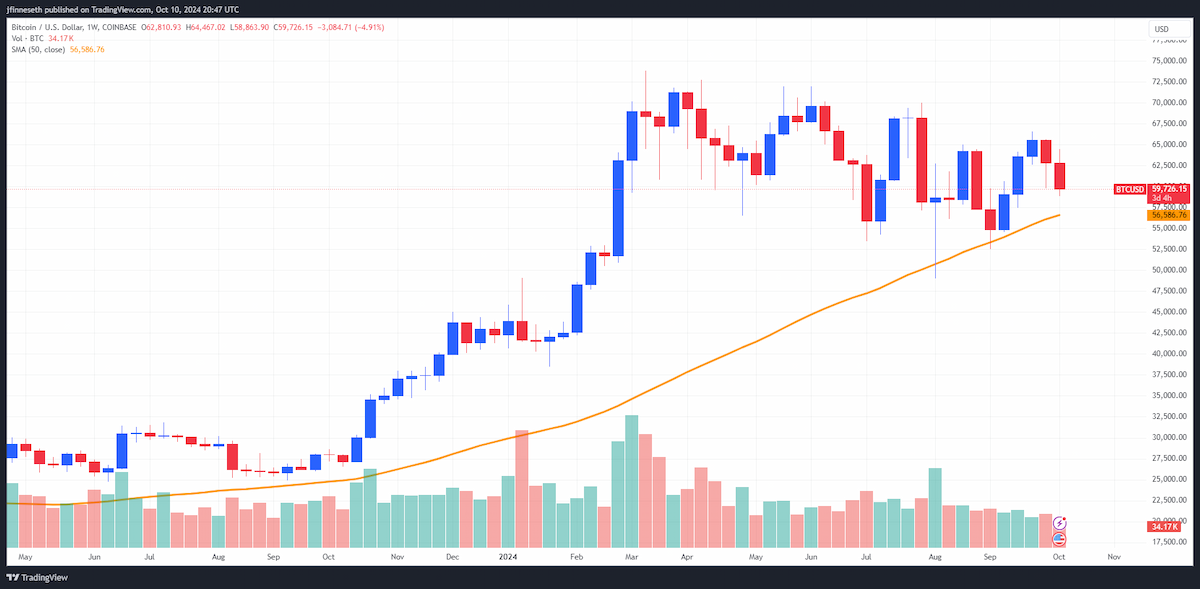
Data provided by TradingView shows that a spike in sell-side volume briefly saw Bitcoin (BTC) dip below $59,000 for the first time since the middle of September.

BTC/USD Chart by TradingView
Technical traders are now waiting to see if the recovery back above $59,500 will hold. The downside wick produced could signal a bullish move ahead, just as the upside wick to $64,500 on Monday signaled the potential for a pullback.
The one positive in Bitcoin’s struggle to gain momentum is that it could provide an opening for altcoins to rally, though the general risk-off sentiment following the CPI report could negate this possibility.
“Bitcoin’s market share, often referred to as its dominance, has been on a gradual ascent since mid-2022 and has now reached another multi-year peak at 58.5%—the highest level since March 2021,” noted Secure Digital Markets analysts. “There appears to be a positive correlation between Bitcoin's dominance rate and U.S. interest rates. The onset of rate cuts could potentially disrupt this upward trend in Bitcoin's dominance, potentially paving the way for altcoins to capture a larger market share.”
At the time of writing, Bitcoin trades at $59,720, a decrease of 1.4% on the 24-hour chart.
Short-term uncertain, long-term bullish
“After the Fed cut rates by 50 bps in September, their dovishness gave the People’s Bank of China (PBoC) room to do some easing of their own,” said market analyst Bloodgood in his latest update. “Following the Fed, the PBoC announced some fairly aggressive stimulus measures, including lower rates, reducing reserve requirements for banks and more measures to inject liquidity into the market.”
“This isn’t yet anything like the ‘bazooka stimulus’ that China introduced in response to the global financial crisis in 2008,” Bloodgood said, but “it’s a step in that direction, one that was sufficient to have an effect on the stock market.”
“As for timing, the reason the Fed cut was probably relevant here is that the PBoC can afford to be more aggressive when the Fed is being more dovish as well; given downward pressure on USD from lower rates in the U.S., stimulus by the PBoC is less likely to negatively impact the Chinese Yen in relation to the USD,” he added.
“That’s a crucial thing to keep in mind with monetary policy in general: it’s not that central banks copy one another (even though it’s definitely easier for any central bank to justify cutting rates because ‘look, the Fed did that too!’), but more so that various forms of money printing are largely constrained by one currency’s exchange rate with other currencies,” Bloodgood explained. “If the USD is set to weaken due to dovish monetary policy, then that gives other central banks room to make their own printers go brrr as well.”
As for Bitcoin, Bloodgood highlighted that uncertainty has risen in the minds of traders as Bitcoin has “teased with a fake breakout above daily resistance.”

“Since our last analysis, Bitcoin was on its way toward the mentioned resistance at $64.6k,” he noted. “A lot has happened since then—many traders got caught in early longs, and a liquidation event led Bitcoin back to $60k. However, looking at the macro picture, we can see that BTC made a higher high before dropping back down, which is what bulls have been waiting for since May.”
“At the time of writing, we are once again slightly above the support that must hold if we want to see another higher high anytime soon,” he said. “In any case, the long-term outlook is bullish as the structure shows signs of a trend change. The short-term is uncertain, but support is a good place to bid.”
According to TradingView analyst TradingShot, while the daily chop is confounding traders, technical analysis of the long-term chart shows that “the market is repeating almost the exact sequence of a year ago (October 2023).”
“The similarities are more obvious on the 1D time-frame where the price is currently ranged within the 1D MA50 (blue trend-line) and the 1D MA200 (orange trend-line),” he said. “The most recent time it traded like this was exactly one year ago, back in the first two weeks of October 2023.”
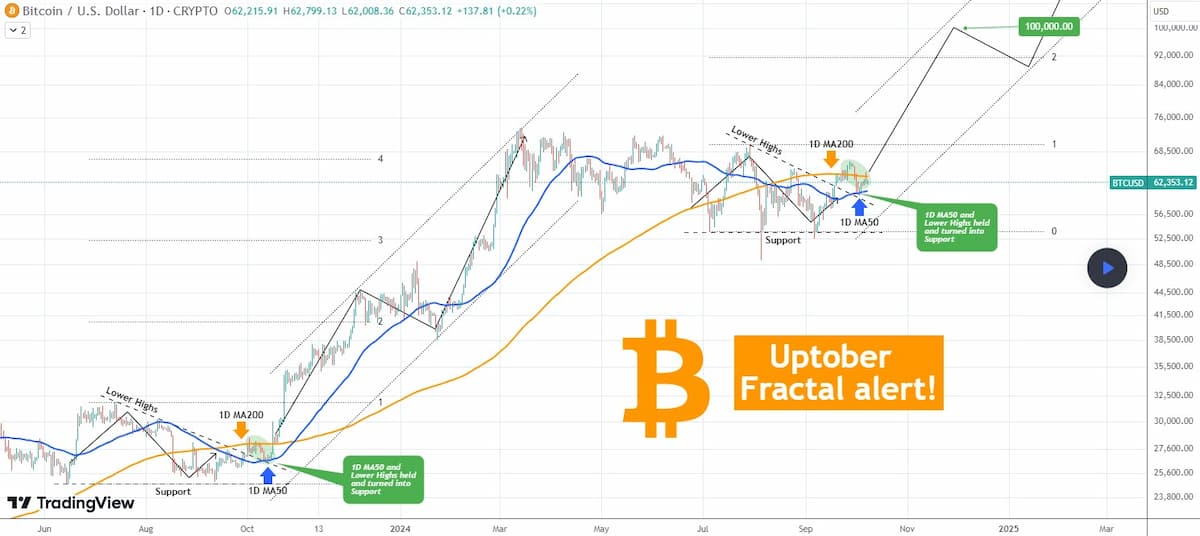
“As you can see, during that time, BTC also made a marginal break above the 1D MA200 before quickly pulling back below it,” TradingShot noted. “After it tested and held the 1D MA50 (as it did on October 01, 2024), is started the long-term aggressive rally of the Channel Up that peaked on March 14 2024.”
“As long as the 1W MA50 continues to hold as the long-term Support, there are high probabilities of seeing 100k, even before the end of 2024,” he concluded.
BTC/USD Chart by TradingView
Altcoin weakness follows Bitcoin's pullback
Altcoins took a beating in the wake of Bitcoin’s pullback, with 90% of the tokens in the top 200 recording losses on Thursday.

Daily cryptocurrency market performance. Source: Coin360
Uniswap (UNI) managed to rise above the noise to post a gain of 10.7%, while Zcash (ZEC) increased 9.7% and Baby Doge Coin (BabyDoge) climbed 7.5%. Saga (SAGA) saw the biggest decline, falling 15.9%, followed by losses of 8.5% and 8.4% for Chiliz (CHZ) and Aptos (APT), respectively.
The overall cryptocurrency market cap now stands at $2.09 trillion, and Bitcoin’s dominance rate is 56.4%.