
(Kitco News) – Traders embraced risk-on mode Wednesday as asset prices from gold to stocks and cryptos trended higher amid a rise in expectations for an interest rate cut at the next FOMC meeting in November.
The CME FedWatch Tool shows the odds of a 25 basis point rate cut on Nov. 7 now stand at 94%, up from 80% last week, as concerns that the Fed would be forced to hold rates steady have begun to wane, especially following yesterday’s ASML-fueled pullback in equities.
A positive quarterly report from Morgan Stanley also helped boost sentiment as traders took the sight of a y/y jump in profits as a sign that the economy is getting back on track. At the closing bell, the S&P, Dow, and Nasdaq all finished higher, up 0.47%, 0.79%, and 0.28%, respectively.
Data provided by Trading View shows that Bitcoin (BTC) bulls leveraged support at $67,000 to make a run at $68,000 resistance in the early going on Wednesday but have thus far been stymied in their efforts as multiple attempts to break above the level have been met with firm pushback from bears, who have thus far managed to hold their ground.
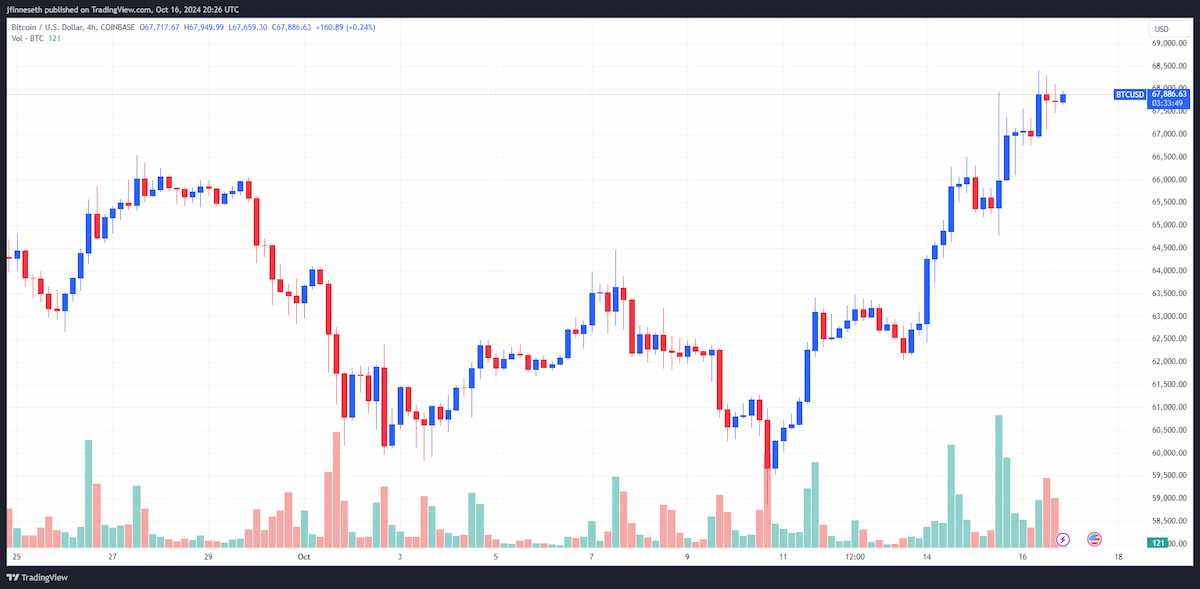
BTC/USD Chart by TradingView
“Bitcoin is currently challenging its previous peak at $68,000, with market sentiment bolstered by increased speculation of a potential victory for Trump in the upcoming election, which has significantly boosted demand for Bitcoin exposure,” said analysts at Secure Digital Markets.
“Over the past week, Bitcoin has consistently outpaced equity markets in performance,” they added. “A notable surge in activity is evident as Bitcoin’s futures open interest on the CME has soared to a record 172,430 BTC, equivalent to $11.6 billion, indicating robust bullish sentiment among active traders.”
“The options market is displaying a pronounced bullish tilt for both Bitcoin and the US dollar in the near term,” the analysts noted. “Typically, Bitcoin exhibits an inverse correlation with the dollar index (DXY); however, this relationship might diverge as we approach the U.S. elections, according to current options market trends.”
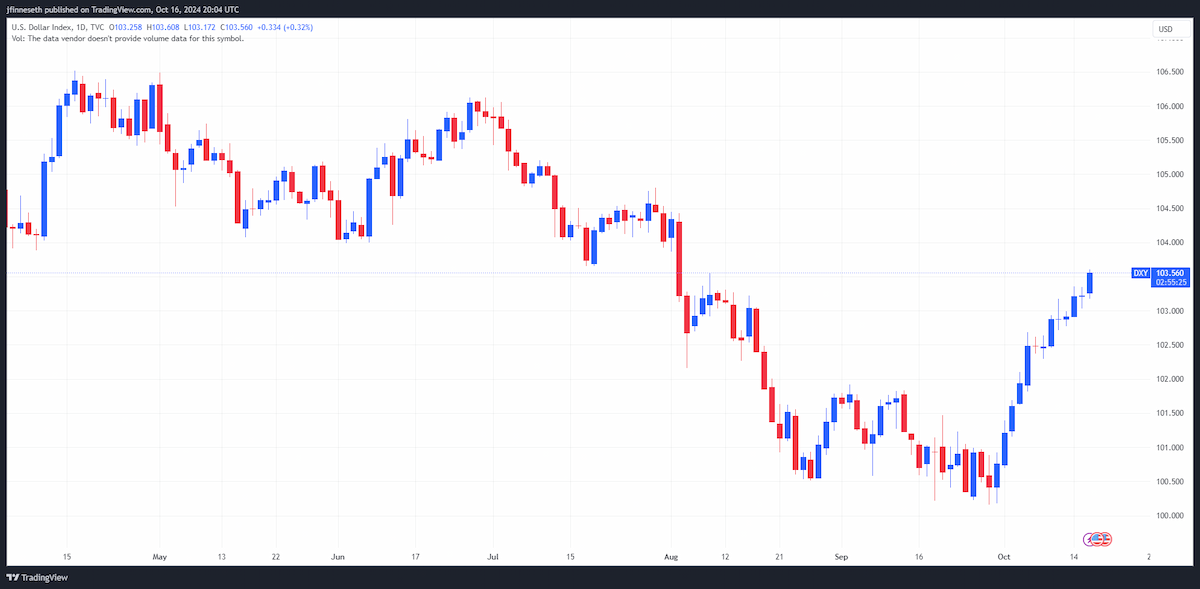
DXY Chart by TradingView
At the time of writing, Bitcoin trades at $67,870, an increase of 1.62% on the 24-hour chart. After hitting a high of $2,862/oz earlier in the day, gold currently trades at $2,673.60/oz for a gain of 0.44% on the session.
Warning signs for a potential correction
Amid the rising price of Bitcoin and its historical performance in the year following a halving, crypto bulls are starting to make their presence known in the market, which could lead to a correction in the near term as retail starts to FOMO.
“The current sentiment in the market, as indicated by the Fear & Greed Index, is flashing key signals that should not be ignored,” said Shubh Varma, co-founder and CEO of Hyblock Capital. “First, the oscillation between fear and greed is becoming increasingly frequent, with fewer days separating the shifts. This compression suggests that uncertainty remains high, and the market is hypersensitive to even the smallest triggers.”
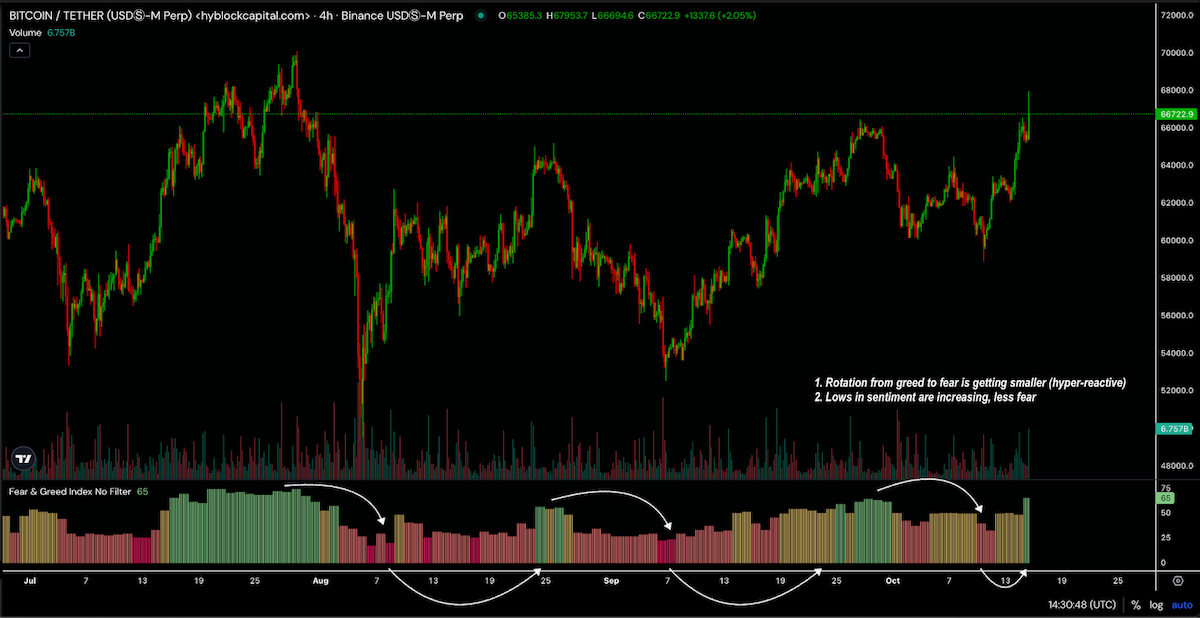
“However, what's more striking is that each time the price dips, there is less fear in the air,” he added. “In the most recent downturn, sentiment only hit ‘fear’ rather than ‘extreme fear,’ which has typically marked market bottoms in the past. This shift suggests a larger sentiment change is taking hold, reinforced by the fact that Bitcoin’s dips have been well-defended, signaling strong underlying support.”
“On the retail side, we are seeing something equally telling,” Varma said. “The percentage of retail longs is now approaching low levels, with less than 40% of Binance BTC accounts in long positions. This metric oscillates between 0 and 100, but typically stays within a much tighter range, making this current low reading more significant.”
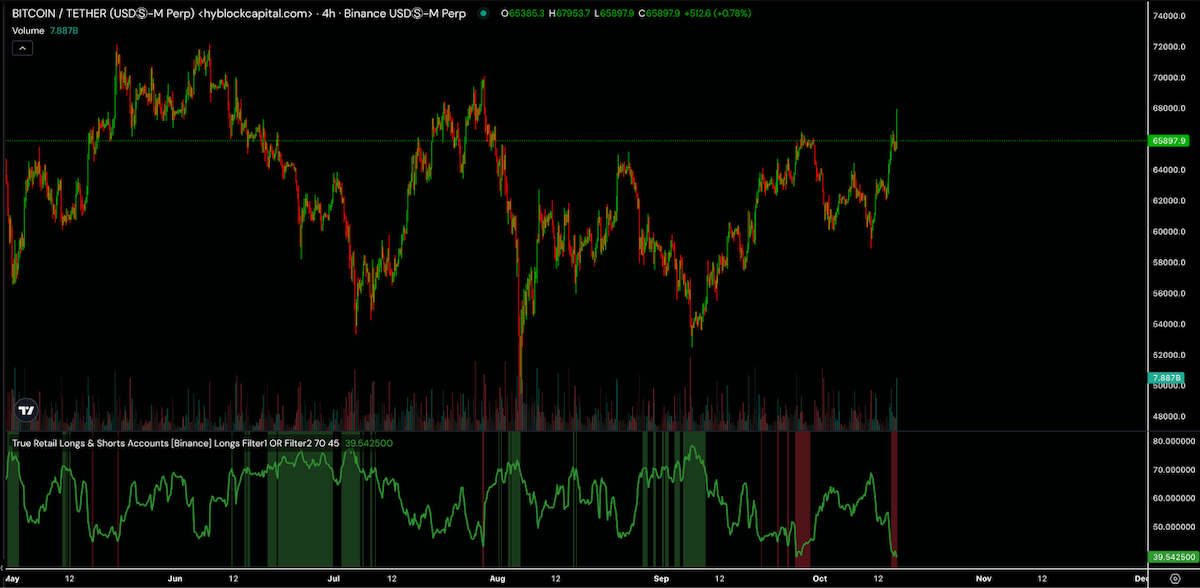
“When retail participation in long positions reaches such low levels, the likelihood of a reversal increases,” he explained. “Historically, when this indicator reverses from low to high, it signals that retail traders are entering longs en masse—often a bearish signal. Retail investors tend to be on the wrong side of the market, and their shift from shorts to longs frequently marks a local top. As they pile into long positions, the market tends to trap them by reversing downward, causing a price decline. If this trend follows its usual pattern, we could soon see a correction designed to catch retail traders off guard once again.”
Varma warned that several bearish indicators suggest the rally to $68,000 could soon see a pullback.
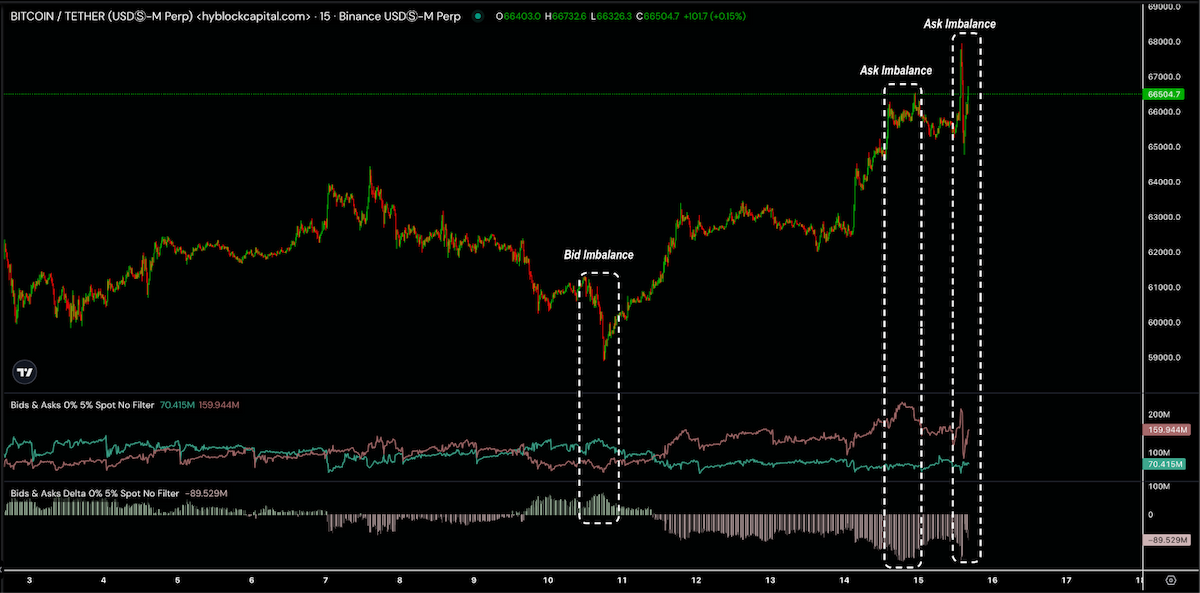
“The orderbook data supports this bearish outlook, with ask imbalances beginning to pile up,” he said. “These imbalances mean that the market now faces growing resistance on the upside, as it would require substantial buying pressure to overcome the layers of limit sell orders sitting above the current price.”
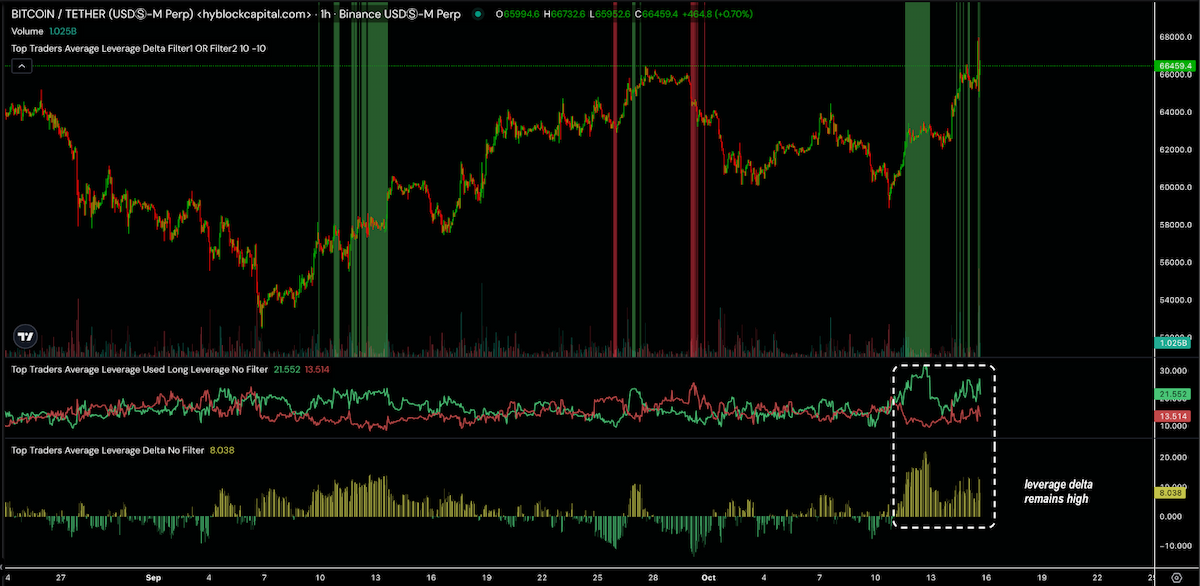
While the bearish signals continue to mount, Varma said the one bullish glimmer of hope is that “top traders are still taking out more long leverage than shorts, on average. This behavior typically signals confidence in further upside, though it's crucial to monitor the levels at which this leverage was taken out. Should price revisit those levels, it will be an important test for the market’s strength.”
“Leverage plays an ongoing role in the market's behavior, and the liquidation heatmap gives us an insightful view of what might happen next,” he noted. “The recent pump seemed to head straight for liquidity, and in our last report, we forecasted this move. We expected a dip into long liquidations followed by a bullish continuation, with price heading for the 66k-70k short liquidations. That has largely played out.”
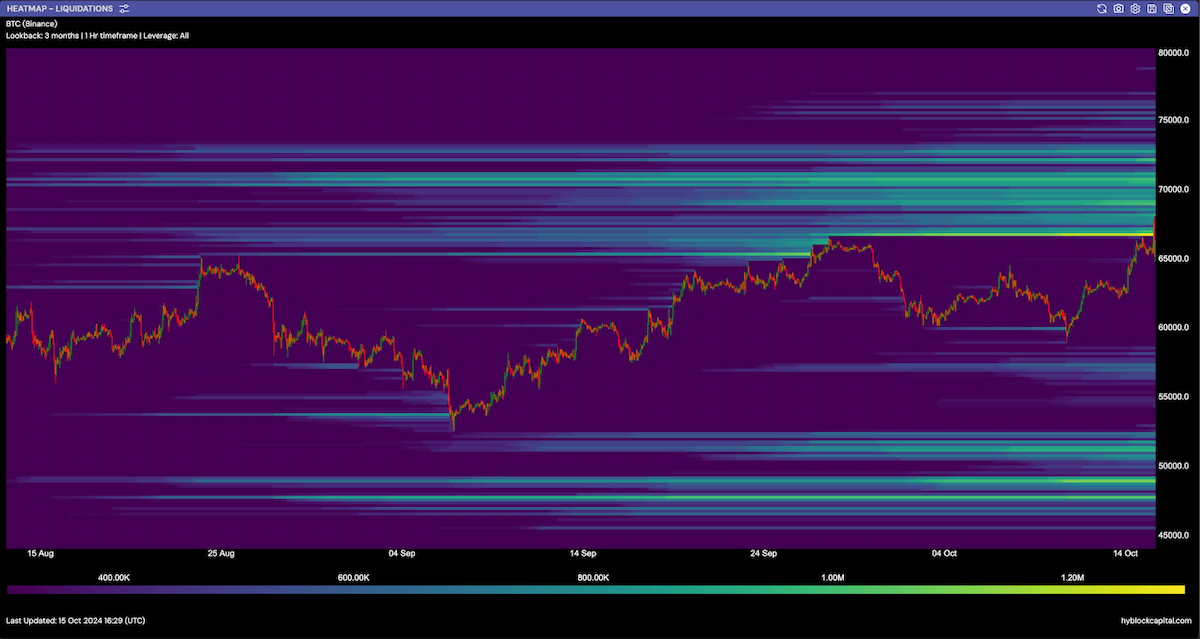
“The next key question is whether the market will ignore the current bearish signals and continue through all the remaining short liquidations,” he said. “While there is a possibility of a bullish cascade upward, a more likely scenario is one more dip before clearing the remaining short-side liquidity.”
“Adding to this narrative is the behavior of open interest (OI), which has recently increased to its historical resistance level,” he underscored. “Typically, when OI reaches these heights, we see a corrective move that flushes out late longs.”
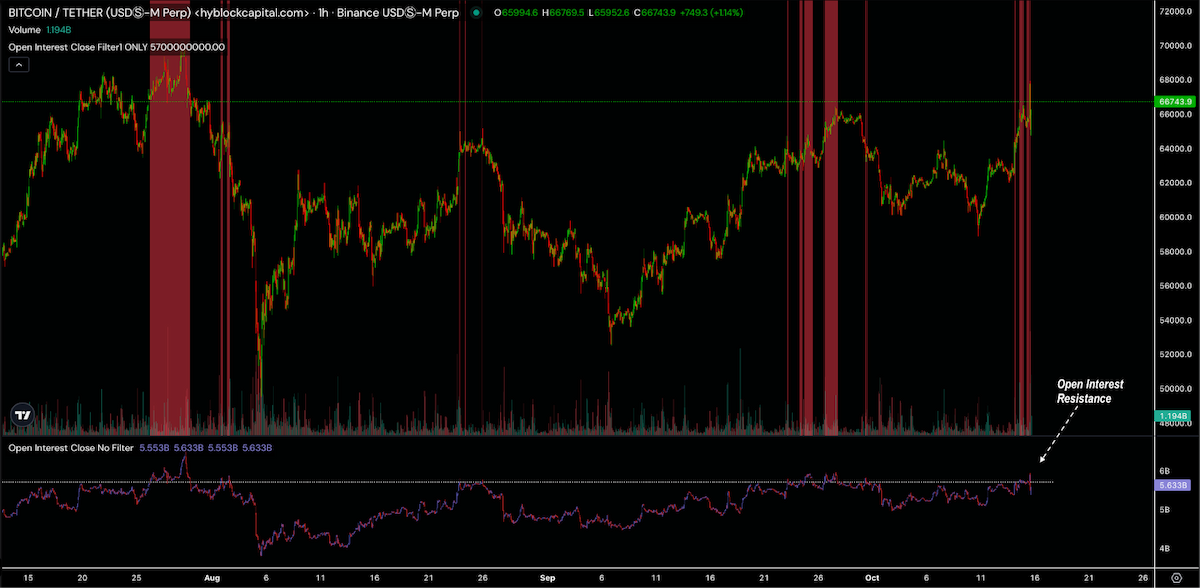
“If the market were to correct this week, tracking OI will be crucial,” he stressed. “A decrease in OI following a price dump would confirm that long positions are being flushed, whereas sustained or increasing OI would signal deeper market issues.”
Further adding to the need for caution is the fact that “On a broader scale, the entire crypto industry is displaying risk-on behavior,” Varma said. “Over 200+ tickers are seeing a surge in OI cumulative change, with meme coins like POPCAT and NEIRO leading the charge. This fervor in chasing high-risk assets is a clear warning sign. Global open interest has declined over the past two weeks, suggesting that flows may be shifting from altcoins to meme coins. This shift is another reason to remain cautious.”
“While Bitcoin’s price is supported by key bullish factors, including well-defended dips and top traders taking long leverage, the broader market is rife with warning signals,” he concluded. “With retail longs approaching a tipping point, CVD divergences, orderbook ask imbalances, and meme coin hysteria, the prudent move may be to expect a final dip before the market attempts another leg up. As always, remaining vigilant and keeping a close eye on OI and sentiment shifts will be essential in navigating the next steps in this volatile environment.”
Split performance in the altcoin market
It was a mixed day for the altcoin market, with a slight majority of tokens in the top 200 recording losses.
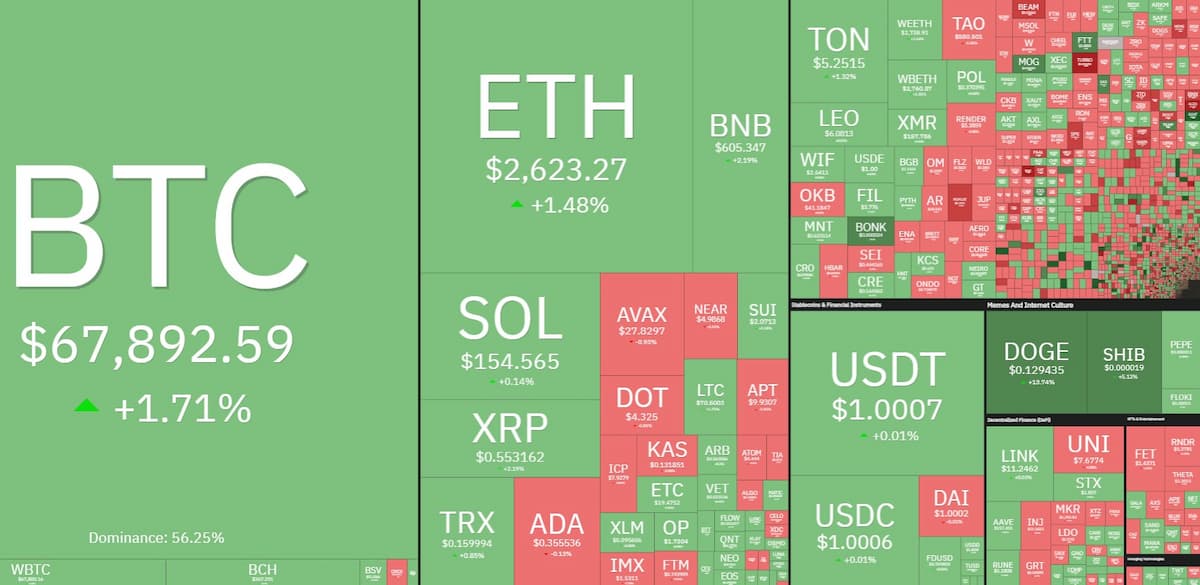
Daily cryptocurrency market performance. Source: Coin360
FTX Token (FTT) was the top performer, gaining 14.4%, followed by increases of 10.8% and 8.1% for Dogecoin (DOGE) and Scroll (SCR), respectively. BinaryX (BNX) fell 12% to lead the losers, while Popcat (POPCAT) lost 9.1%, and Memecoin (MEME) fell by 9%.
The overall cryptocurrency market cap now stands at $2.32 trillion, and Bitcoin’s dominance rate is 57.7%.