
(Kitco News) – Gold has been on a tear in 2024, with the latest record high coming in the early hours on Monday, and while the yellow metal has looked near-unstoppable recently, one analyst suggests there is one thing that could spoil the party: a surge in bond yields.
“New highs in the ratio of gold to US Treasury bonds could be vulnerable to some reversion, especially if Vice President Kamala Harris wins the presidency and the House or Senate is controlled by Republicans – a check on rising budget deficits,” said Mike McGlone, Senior Commodity Strategist at Bloomberg Intelligence. “The record-setting metal and rising bond yields, on the back of Federal Reserve easing, may be pricing in inflation and volatility if former President Donald Trump gains a second term.”
McGlone questioned, “Is Gold Overheating Compared to T-Bonds?”
“Gold's parabolic run vs. US Treasury-bond prices appears unsustainable, especially if Harris wins the presidency,” he reiterated. “Our graphic shows the rare crocodile-jaw pattern of the metal's hot price vs. the cold Bloomberg US Treasury 20+ total return gauge and vs. the S&P 500.”
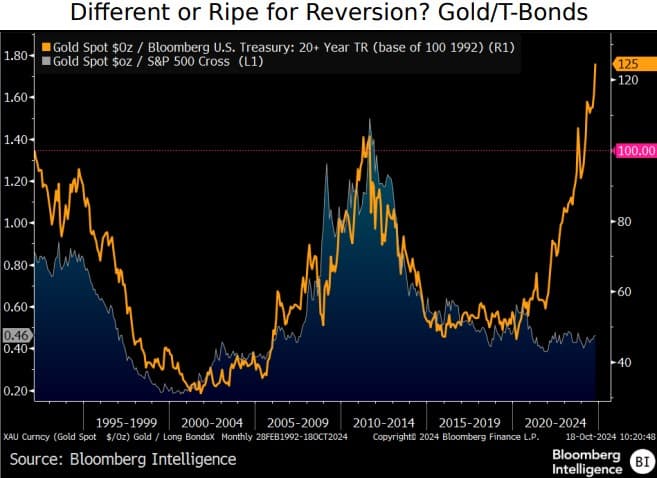
“The gold/T-bond ratio ended Oct. 18 at 125, a new high from a base of 100 in 1992 and exceeding the 2011 peak with a key difference – the S&P 500 has far outperformed the metal,” McGlone observed. “The potential for some retracement appears as likely as when the gold/T-bond ratio dropped to 47 in 2015 from 107 in 2011.”
“Such wide performance disparities are unusual and can be enduring, but the US presidential
election could be a spark for reversion,” he said. “A Harris presidency with a Republican-led Congress reluctant to approve new spending may portend headwinds for gold.”
That said, McGlone suggested that “A bit of reversion risk may favor T-Bonds vs. gold.”
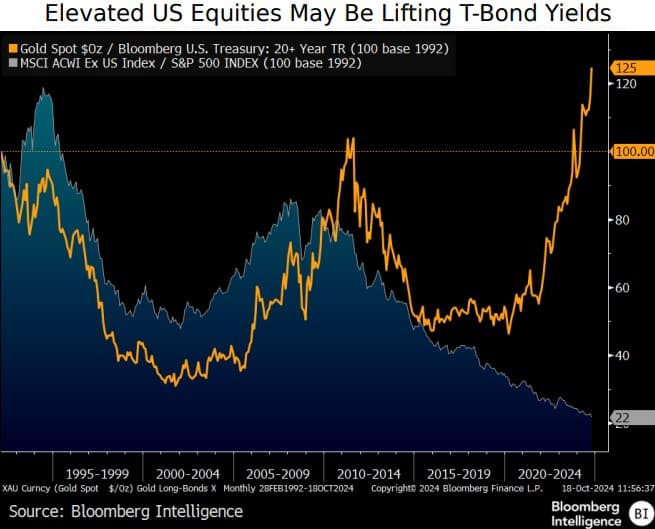
“The longer the S&P 500 can sustain a steep premium to the rest of the world's stock markets, the more likely US Treasury-bond prices will remain repressed vs. gold,” he said. “It was the peak in the MSCI ACWI ex US Index vs. SPX in 2007 that marked a high in the ratio, followed by a sustained downward trajectory.”
“The potential for some reversion in the extreme level of US stock-market exceptionalism vs. global equities or elevated gold vs. T-bonds is our takeaway from the graphic,” he added. “It could be a question of a catalyst, and at the top of our radar is the US election.”
“At about 2x market capitalization-to-GDP, approaching the highest in about 100 years, some stock price normalization could complement falling crude oil, energy and grain prices, and add deflationary forces to T-bond yields,” McGlone suggested.
He also said that a pause in the rise of bonds vs. oil could soon come to an end amid oil price weakness.
“The stalled uptrend in the iShares 20+ Year Treasury Bond ETF (TLT) vs. crude since 2008 may be ripe for resumption,” he said. “At the same spread on Oct. 18 as first reached 16 years ago, our graphic shows the TLT/crude ratio locked in a narrowing cage.”
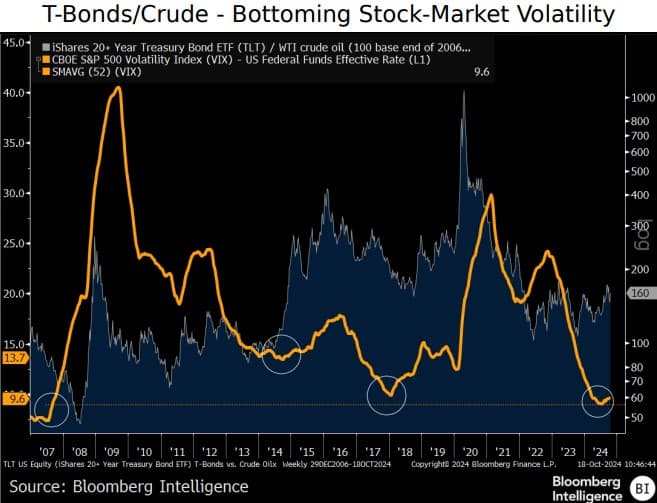
“A top spark that could refuel the path that's been ascending since 2008 may be a bit of reversion in extremely low stock-market volatility and high rates,” McGlone noted. “At 9.6%, the 52-week average of the Cboe Volatility Index minus the fed funds rate may be bottoming from the lowest since 2007.”
“Low stock-market volatility and elevated rates in 2006-07 preceded the Great Recession, and launched TLT/crude from a base of 100 to 1,000 in 2020,” he concluded. “It might not be a coincidence that the Treasury two-year note yield peaked in April at about 5%, along with the $87.67 high in WTI.”