

(Kitco News) – Stocks and cryptos faced early pressure on Tuesday while gold continued its trek higher as Monday’s spike in bond yields has given investors reason to pause their bullish enthusiasm amid increasingly volatile markets.
The major indices all opened lower “following a mixed, but overall negative session on Monday,” noted David Morrison, Senior Market Analyst at Trade Nation. “Yesterday, the NASDAQ was the only major index to close in positive territory, helped by a 4.3% rally in NVIDIA. On the other side, the small cap Russell 2000 lost 1.6%, the Dow ended 0.8% lower, while the S&P lost a more modest 0.2%. There was little in the way of data releases or corporate earnings to offer direction.”
“Investors looked askew at the bond market, where yields jumped sharply, sending Treasuries and other debt instruments lower,” he added. “The yield on the 10-year Treasury note jumped 12 basis points, taking it to 4.19%, its highest level since the end of July. Yields are a touch firmer again this morning, and this is weighing on equities to some extent.”
“The move suggests that investors are reassessing the timing and size of future rate cuts from the Fed’s FOMC,” Morrison said. “While the probability of a 25 basis point cut at next month’s meeting is still around the 90% mark, it has drifted lower over the past week. Perhaps more significantly, the probability of a repeat cut at the December meeting has fallen from 85% last week to 67% today. Unfortunately, the CME’s FedWatch Tool is less clear over the expected path of cuts for 2025.”
“It seems that a touch of uncertainty over the next major move for equities has crept in this week. If investors hear some decent third quarter updates today, along with some positive forward guidance, then markets could quickly turn positive once again,” he noted. “But the VIX has popped up this morning. Add in higher yields and uncertainty ahead of an election which remains too close to call, then it’s possible that equities may have to pull back a bit further before investors feel confident enough to add to their exposure.”
Regarding gold’s continued rise, Morrison warned that while the yellow metal “is certainly showing some resilience, and the daily MACD remains encouraging,” investors should be cognizant that “both the weekly and monthly look very overbought. That would suggest, but not guarantee, that gold is getting ready for a pullback. Should that happen, then the depth and speed, along with where it finds support, should provide a bunch of clues over what happens next.”
“For some, a sell-off now may signal that the bull run is over. For others, it may be an opportunity to load up,” Morrison suggested. “One thing is for sure, and that’s that gold is finally being talked and written about as a worthwhile speculation, if not an outright investment. Meanwhile, silver is playing catch-up and back above $34 per ounce, its highest level in twelve years. If it can hold this level and consolidate, then further gains look likely.”
As for cryptos, Bitcoin (BTC) and the majority of altcoins in the top 200 experienced slight declines in early trading on Tuesday, but the market is showing signs of stabilizing.
“Cryptocurrency capitalization has corrected 1.8% over the past 24 hours to $2.34 trillion,” noted Alex Kuptsikevich, senior market analyst at FxPro. “However, these figures reflect a partial recovery from earlier lows of around $2.27 trillion earlier in the day. For now, this appears to be a case of profit-taking during the upward trend, but it’s worth keeping an eye on the market dynamics over the next few days.”
“The main reason for the entire crypto market's subsidence seems to be Bitcoin, which the bears defended against an assault on the $70K level,” he said. “They intensified selling at $69.5K early in the day on Monday and dropped the price to $66.5K on Tuesday morning.”
Aside from the macro reasons for the recent weakness, Kuptsikevich also highlighted that “Stablecoin volume has not increased since late September, setting up a potential pause in the growth of the broader cryptocurrency market, as stablecoins are often seen as liquidity for quick purchases of coins of interest. The previous growth momentum was from August to September when the overall crypto market capitalization pushed off the bottom.”
Analysts are widely citing the approaching elections in the U.S. as a major influence on the crypto market currently, but according to TradingView analyst TradingShot, the Bitcoin four-year cycle will soon be the primary driving force for the crypto market.
“It's been some time since we last used the Mayer Multiple Bands (MMB) on Bitcoin, but the timing is just right to bring you an update, only 2 weeks before the U.S. Presidential Elections with the market ahead on an imminent bullish break-out,” he wrote in a Tuesday update. “This time, we look into how the price was trading on this date every 4 years.”
“As you know, BTC is trading roughly within 4-year Cycles that keep a high degree of symmetry and tend to repeat a lot of dynamics each time,” TradingShot explained. “Right now, towards the end of October (2024), the price is trading within the Mean MM (black trend-line) and the 1st SD above (grey trend-line). It has already started rising off the Mean MM.”
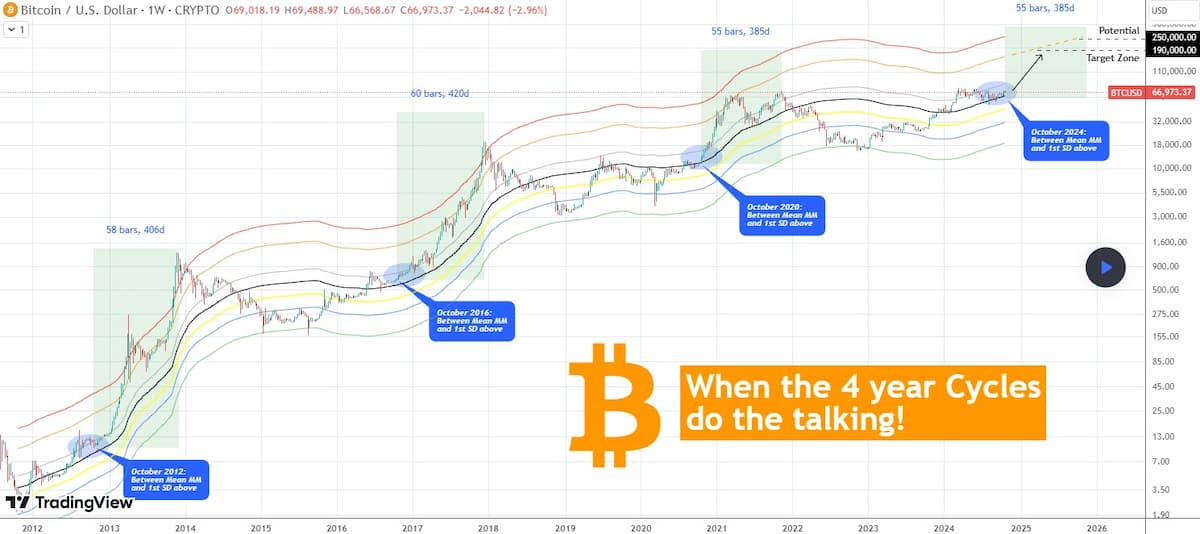
“Based on the 4-year Cycle Theory, it is no surprise then that the price was within the exact same range in October 2020, October 2016, and October 2012,” he noted. “The degree of symmetry is remarkable and is yet again showcased by this indicator.”
“We can also see that by this time every 4 years, the price had already started rising off the Mean MM, just as it is doing now,” he observed. “With the green Rectangles, we display the date range between these 4-year intervals and the peak of the Bull Cycle. For October 2012, it took 58 weeks (406 days) until it topped, October 2016 was 60 weeks (420 days), while October 2020 was 55 days (385 days). So time-wise, the Cycle tends to peak roughly the same period.”
“As a result, if we take the minimum scenario of 55 weeks, we can expect the Cycle to top by mid-November 2025,” TradingShot said. “As far as targets are concerned, the first two Cycles hit (and broke) the 3 SD above (red trend-line), while the last one the 2 SD above (orange trend-line).”
“Again assuming a 'worst case scenario' hitting 'just' the 2 SD trend-line, we can set a Target Range of 190k - 250k, depending on whether the price hits it halfway through the 55-week range or towards its end,” he concluded. “Nevertheless, an exciting rally appears to be starting for Bitcoin.”
At the time of writing, Bitcoin trades at $67,533, an increase of 0.89% on the 24-hour chart.

BTC/USD Chart by TradingView