
(Kitco News) – It was a volatile yet overall positive day for financial markets after a pullback in the DXY and U.S. 10-year Treasury yields opened the door for funds to flow into risk assets, while gold’s price stabilized above $2,730/oz.
The latest jobs data showed that the number of jobless claims unexpectedly fell to 227,000 last week, compared with an upwardly revised 242,000 the week before. However, the number of people collecting unemployment registered at the highest level in three years, suggesting that it's harder for those losing jobs to secure new employment.
Market watchers took the data as a sign that the Fed will move forward with interest rate cuts at the FOMC meeting in November, prompting a return of risk-on investing. The CME FedWatch Tool now puts the odds of a 25 bps cut next month at 95%, up from 88% last week.
Also influencing the rate cut outlook was the Fed’s Beige Book, which “offered a tepid economic outlook, capturing the market's focus and reinforcing expectations of an impending 25 basis point rate cut in November,” noted analysts at Secure Digital Markets.
Stocks climbed higher, buoyed by a stellar earnings report from Tesla, which saw its share price increase 22% – adding over $80 billion in market cap – amid projections that EV sales could grow 20% to 30% next year.
“The S&P 500 rebounded on Thursday following three consecutive losses, despite a nearly 1% drop over the week,” said Secure Digital Markets analysts. “With over a third of the S&P 500 companies having reported their third-quarter results, 76% have surpassed analyst forecasts, injecting a cautious optimism into the market's trajectory.”
At the closing bell, the S&P and Nasdaq were in the green, finishing up 0.21% and 0.76%, while the Dow declined by 0.33%.
Spot gold experienced some minor volatility, ranging from $2,720/oz to $2,743/oz, and at the time of writing, trades at $2,735 for an increase of 0.74% on the session.
“Gold has witnessed a remarkable rally, with inflows exceeding 1 million ounces into ETFs over the last seven days—the most substantial since October 2022,” noted Secure Digital Markets analysts. “This surge in gold investment is sparking discussions about renewed inflationary pressures, with the market participants awaiting a consolidation in gold's rally before committing heavily to riskier assets.”
Data provided by TradingView shows that Bitcoin (BTC) bulls responded aggressively to Wednesday’s bearish smackdown below $65,500, rallying past resistance at $68,000 on Thursday afternoon and now setting their sights on the fortified bear defenses at $70,000.

BTC/USD Chart by TradingView
“The count of whale accounts, holding a minimum of 1,000 BTC, has surged to a historic peak of 1,678 this week, the highest since January 2021,” Secure Digital Markets analysts underscored. “The BTC dominance ratio, a critical indicator of market sentiment, is verging on 59%, reaffirming Bitcoin's sovereignty in a volatile market.”
“However, any retracement in this ratio could signal a potential shift towards altcoins,” they noted. “Meanwhile, Ethereum (ETH) has been ceding ground to Bitcoin and other alternatives as it reaches another yearly low on ETHBTC.”

ETH/BTC Chart by TradingView
“In the realm of crypto ETFs, Bitcoin-focused funds drew $192.4 million in inflows, predominantly spearheaded by a substantial $317.5 million from Blackrock,” the analysts said. “Contrastingly, Ethereum's performance remains lackluster, with modest inflows of $1.2 million despite a higher trade volume of $172.5 million.”
At the time of writing, Bitcoin trades at $68,180, an increase of 2.45% on the 24-hour chart.
Golden cross potential excites Bitcoin bulls
Technical analysts are abuzz about the potential for a golden cross on the Bitcoin chart, which occurs when a moving average (MA) for a shorter duration, such as the 50-day MA (50MA), crosses above a longer duration one, such as the 200MA.
BTC Golden Cross Approaching ?
$100,000 is coming sooner than you think? #Bitcoin pic.twitter.com/U3ochaHAW2— Elja (@Eljaboom) October 24, 2024
As shown on the chart provided by X user Elija, the last time a golden cross appeared on the Bitcoin chart was in November, when BTC traded near $33,000. Once the golden cross transpired, Bitcoin rallied more than 116% to hit a new all-time high near $74,000 in March.
“Bitcoin is ahead of a major bullish formation as most likely by next Monday, it will form a Golden Cross on the 1D time-frame, the first such formation since October 29, 2023,” wrote TradingView analyst TradingShot. “As we've analyzed before, it is no coincidence that exactly one year later, a new 1D Golden Cross emerges as seasonality and long-term Cycles play a pivotal role for BTC.”
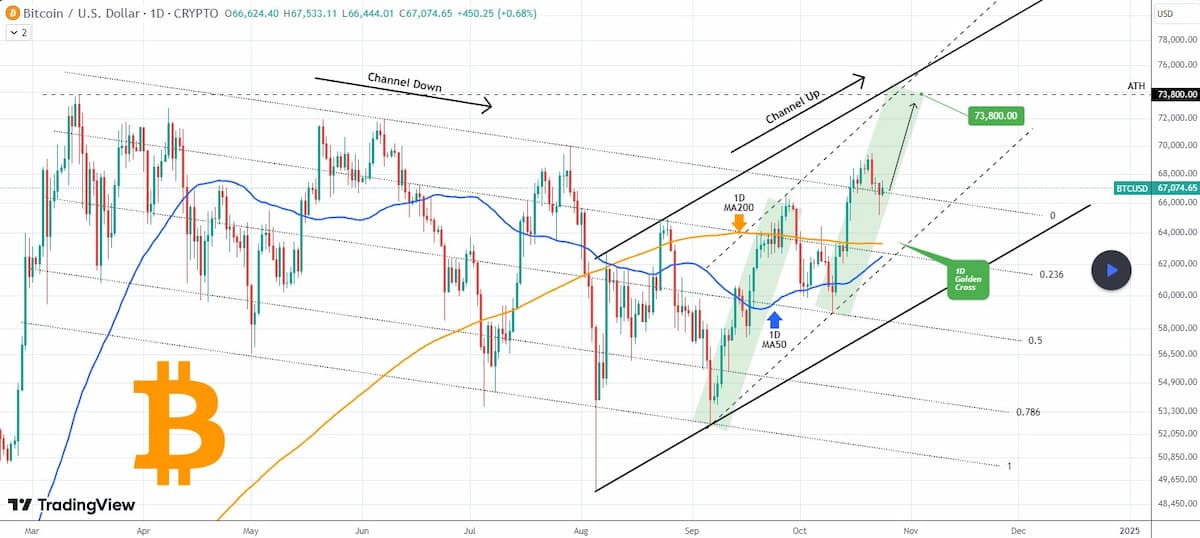
“On top of that, the price made a major re-test (and so far bounce) at the top of the former Channel Down that broke upwards last week,” he added. “If this re-test holds, it is the best short-term signal for a new High. In fact, the price has been making Higher Highs since the August 05 bottom, forming a double Channel Up pattern, and those Higher Highs are the reason why the market got behind this rally and supported it to break above the 7-month Channel Down.”
“So the Higher Highs, along with the 1D Golden Cross, are the bullish combination that the market needs to look (much) higher,” TradingShot concluded. “The first technical target now is naturally the 73800 All Time High (ATH). It is very possible to see it get tested by the election day.”
TradingView analyst Alan Santana provided the bearish outlook, warning that one more major pullback will happen before the real bull market upcycle begins.
“224 Days Bitcoin has been moving lower (sideways),” Santana noted. “I was calling the 2013/14 bullish wave a ‘recovery wave’ based on the action that took place in early to mid-2019. The difference this time around is that Bitcoin went on to produce a new All-Time High, but this was the map we were following.”
“The recovery wave in 2019 led to the March 2020 crash,” he highlighted. “After the peak in July 2019, Bitcoin went sideways with lower highs for exactly 224 days. The last five weeks of this time period produced a bounce, as we are seeing now, and then after one neutral and small red week the final crash leading to March 2020 happened. Nobody saw it coming.”
“We are in a very similar situation, Bitcoin's 2024 capitulation event,” he warned. “The March 2020 crash lasted three weeks of strong bearish action, five weeks total. The first two weeks were a type of suspension at the top before the crash. The drop led to the testing, on a wick, of a low price range in late 2018/early 2019.”
“Today, this would be equivalent to Bitcoin crashing to the same level at which it traded around October/September 2023, that is, on a wick,” Santana said. “It would recover almost instantly from the low prices, and then it would take a while to climb back up into strength.”
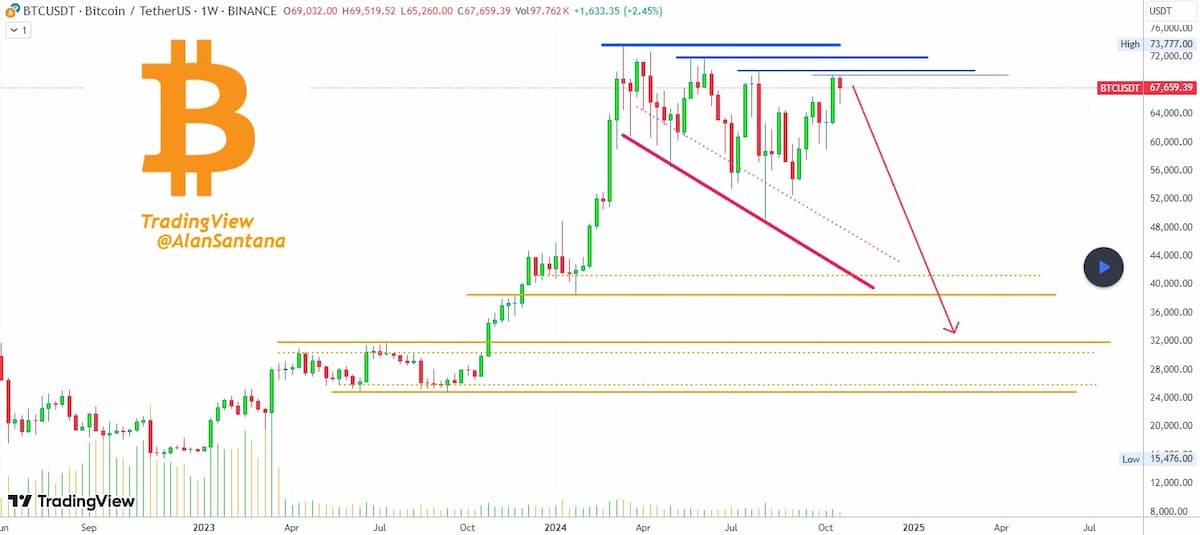
“Prepare for the crash,” he concluded. “The longer it takes for this to happen, the more painful it will be for the market. It has already been long enough, [which] means that the crash will be super strong. 43K is not the bottom.”
Altcoins benefit from risk-on sentiment
The rise in sentiment signaled that it was game on for altcoin traders, leading to a positive day for 90% of the tokens in the top 200.

Daily cryptocurrency market performance. Source: Coin360
Safe (SAFE) was the biggest gainer with an increase of 44%, followed by a 24% rally for cat in a dogs world (MEW), and a 17.3% gain for Ravencoin (RVN). ZetaChain (ZETA) fell 5.7% to lead the losers, while ApeCoin (APE) lost 5.1%, and BinaryX (BNX) declined by 2.7%.
The overall cryptocurrency market cap now stands at $2.33 trillion, and Bitcoin’s dominance rate is 57.8%.