

(Kitco News) – Cryptocurrencies were the odd assets out on Tuesday as stocks and gold climbed higher while Bitcoin (BTC) corrected below $92,000 and altcoins experienced a broad pullback amid the first round of post-halving bull market profit-taking.
“Bitcoin has taken a notable step back from the highly anticipated $100,000 milestone, with traders locking in profits from its impressive post-election rally,” said analysts at Secure Digital Markets.
“A closer look at the Coinbase premium—an indicator of institutional activity—reveals a recent trend of trading at a discount. This hints at softer demand from U.S. buyers,” they noted. “Despite spot trading volumes more than doubling compared to the past few months' average, there’s been a clear decline since BTC hit $90,000, a sign of potential bearish divergence.”
“In the options market, sentiment has shifted,” they added. “The once-dominant call bias has cooled off, and short-term call options expiring this Friday are now priced lower than their put counterparts. This has flipped the risk reversal into negative territory—the first such reading in over a month—suggesting a growing appetite for protective strategies.”
And it's not just cryptos that are showing a change in sentiment as stock trading has become choppy, the analysts said.
“Traditional markets are grappling with uncertainty. S&P 500 futures have been choppy as traders weigh potential fallout from President-elect Donald Trump's proposed tariffs—25% on Mexican and Canadian imports and an additional 10% on goods from China,” the analysts underscored. “With the U.S. market closed Thursday for Thanksgiving and an early close Friday, expect trading activity to remain subdued.”
At the close of markets, the S&P, Dow, and Nasdaq all finished in the green, up 0.57%, 0.28%, and 0.63%, respectively.
After oscillating between a low of $2,613 and $2,642 on Tuesday, spot gold returned to where it started the day and, at the time of writing, trades at $2,632.40 for a gain of 0.31% on the session.
Data provided by TradingView shows that Bitcoin faced bearish pressure throughout the trading day, falling from a high of $95,000 in the early morning hours to a low of $91,430 near the U.S. market open. Bulls attempted to rally higher in the afternoon, but they ran into bearish resistance at $94,800, resulting in BTC once again sinking below $92,000.
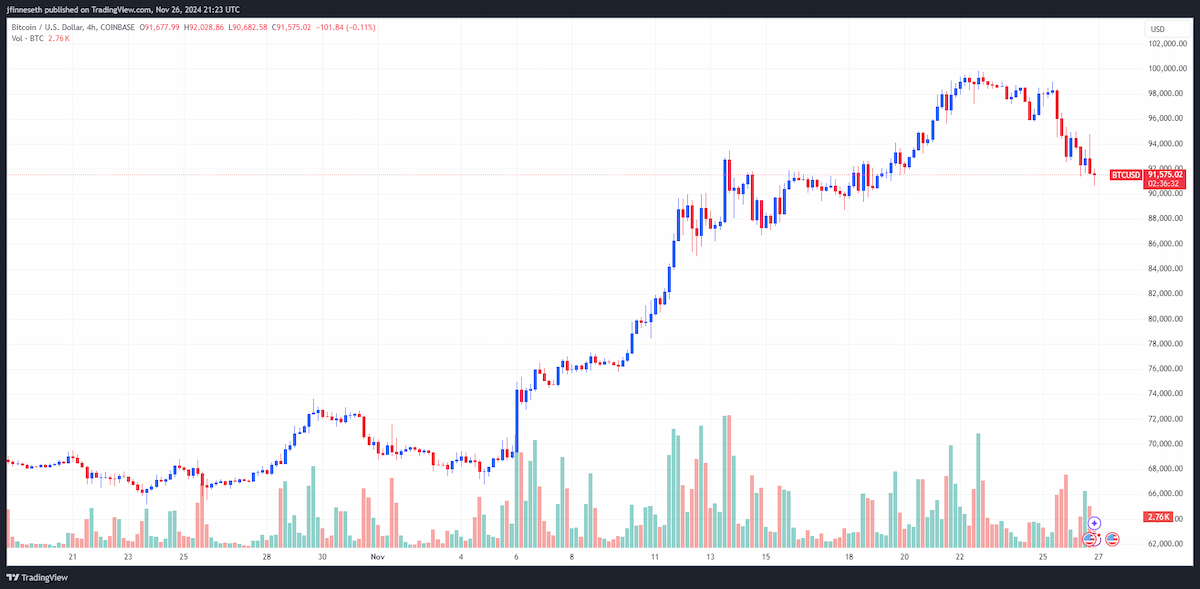
BTC/USD Chart by TradingView
At the time of writing, Bitcoin trades at $91,565, a decline of 3.44% on the 24-hour chart.
A healthy bull market correction
While Bitcoin has experienced a sharp sell-off after hitting a new record high of $99,800, market analysts widely agree that the correction was expected and see it as setting the stage for the next leg up to take shape.
“Bitcoin has run into some resistance ahead of the much talked about $100,000 barrier,” said Joel Kruger, market strategist at LMAX Group, in a note to Kitco Crypto. “The latest attempts to cross the milestone have failed, resulting in what had already been a due period of corrective activity.”
“As per our technical insights, the outlook remains highly constructive, with the previous record high around $75,000 now acting as formidable support,” he noted. “We wouldn’t rule out a sharp decline back towards the March high, but at the same time, it’s quite possible renewed demand emerges well ahead of that level, for a higher platform ahead of that next big push through $100,000.”
Kruger suggested that from a fundamentals standpoint, “it’s possible a lot of the euphoria around the promises of the incoming US administration has started to fade. This has opened some profit taking on a parabolic move in the price of MicroStrategy stock, which could be spilling over into Bitcoin sentiment.”
“But again, we aren’t surprised to see some selling ahead of $100,000 and fully expect there to be plenty of demand on dips as technical studies normalize from extended readings,” he added. “On Monday, we highlighted signs of a possible shift in the trend for ETHBTC and in the hours that followed the release of the report, ETHBTC put in a strong performance.”
“We think there is room for plenty more of this in the days and weeks ahead, especially as optimism ramps up towards alternative tokens beyond Bitcoin in a Trump administration,” Kruger concluded. “Looking ahead, we get the Fed Minutes late in the day. The event risk could inspire some volatility in markets, which could then spill over into crypto. So it will be worth keeping an eye.”
While analysts were largely anticipating a pullback for Bitcoin, retail traders will still caught off guard by the rapidity of the downturn, as evidenced by the liquidation of nearly $1.1 billion in long positions since the BTC peak on Friday, according to data from CoinGlass.
“Yesterday's brutal Bitcoin rejection caught the majority of the market off guard,” wrote TradingView analyst TradingShot. “There are a few fundamental reasons – there is the exhaustion of the post-election euphoria, there is the psychological weight of the $100,000 barrier. However, there is one major technical reason that has gone under the radar.”

“As you can see on this chart, the underlying pattern has been a Fibonacci Channel going through the last 3 Cycles (including the current one),” he highlighted. “The pattern started with a strong rebound on its bottom (green circle) that formed the December 2013 Top. That Cycle Top was on the 0.236 Fibonacci level of the Cycle, and that is a level that rejected rallies during Bull Cycles on June 24, 201,9 and May 11, 2024.”
TradingShot said the recent pullback resulted from Bitcoin running into “the first real resistance of the bull cycle.”
“That is the Fib trend-line that (more recently) rejected the uptrend on November 22,” he explained. “We can call this the '1st Real Resistance of the Bull Cycle' as this is the first major rejection level that a Bull Cycle faces before the eventual Top. That high during the last 2 Cycles has been on the 0.0 Fibonacci level, technically the top of the Channel (red circles). The red spot on the current Cycle in late 2025 doesn't represent a projection but is an illustration for comparison purposes.”
TradingShot also observed, “that the duration of each of the past Bull Cycles has been roughly 150 weeks (1050 days), so a repeat of this pattern would give us a High towards the end of September/early October.”
“It is much better to try to time the High and sell than put an actual price tag on it,” he noted. “Equally interesting is the fact that even though BTC is on a technical rejection, the current rally started on the August 05, 2024, low, exactly on the 1W MA50 (blue trend-line). Technically, as long as this trend line holds, the cyclical bullish wave should stay intact.”
Sea of red in the altcoin market
Altcoins were hard hit by the crypto pullback, with 90% of the tokens in the top 200 recording losses on Tuesday.

Daily cryptocurrency market performance. Source: Coin360
Goatseus Maximus (GOAT) was one of the few resistors, gaining 13.4% on the day, while Fantom (FTM) climbed 11.4%, and Golem (GNT) gained 10.9%. Aelf (ELF) was the biggest loser, falling by 18.5%, followed by a loss of 13.4% for The Sandbox (SAND), and a decline of 11% for Curve DAO Token (CRV).
The overall cryptocurrency market cap now stands at $3.14 trillion, and Bitcoin’s dominance rate is 57.8%.