
(Kitco News) – With gold trading above $4,000 this week, many investors and analysts are asking whether the yellow metal is overbought and the top is in. And while the ETF and futures markets suggest that gold prices still have plenty more upside, other metrics are sounding the alarm, according to Charlie Morris, founder and Chief Investment Officer at ByteTree.
In the latest issue of the Atlas Pulse Gold Report, Morris wrote that this gold bull market is not being driven by excessive speculation.
“The market is hot, but it’s not red hot,” he said. “For that, I would need to see significant buying in the gold ETFs, which have been modest so far, and more long positions in the futures market.”
He noted that investors are increasingly taking sides since gold surpassed the $4,000 price threshold. “On the one side, it’s the debasement trade, and on the other, a barbarous relic continuing its 6,000-year bubble,” he said. “No doubt gold is hot, but that doesn’t mean a crash is coming. Indeed, whatever the final high turns out to be, pullbacks will be inevitable along the way.”
Morris wrote that a tactical investor should pay close attention to the following chart, which measures the pace of the gold rally against its 200-day moving average. “Today, that is 25%, which is slightly below the levels seen at the peaks in 2011 and 2020,” he noted.
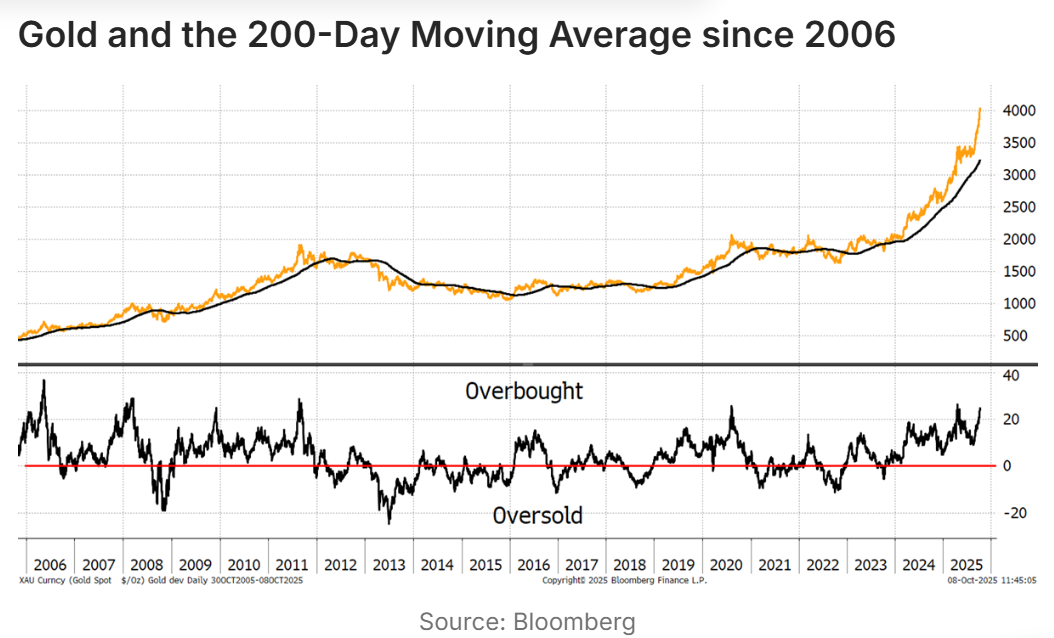
“Then again, I remind investors that in 1979, that number reached 150%, which turned out to be a bubble, and didn’t see the next new high for 27 years,” he said. “It is a reminder that no indicator is infallible, and the recent reading may simply be a pause like we saw in 2006 or 2008 during a healthy bull market.”
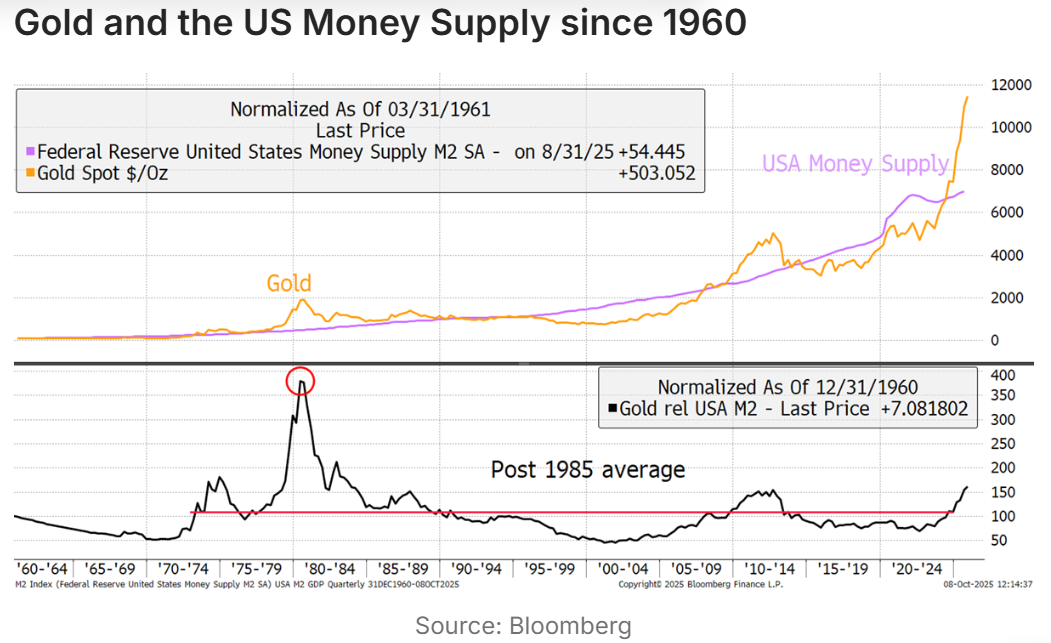
“Of course, this time is different, as it always is, even though for the cynics, it’s always the same,” he wrote. “The G20 money supply continues to grow, and the gold price is now 38% above average. It is also above the 20% reading in 2011, which most would agree was a bubble.”

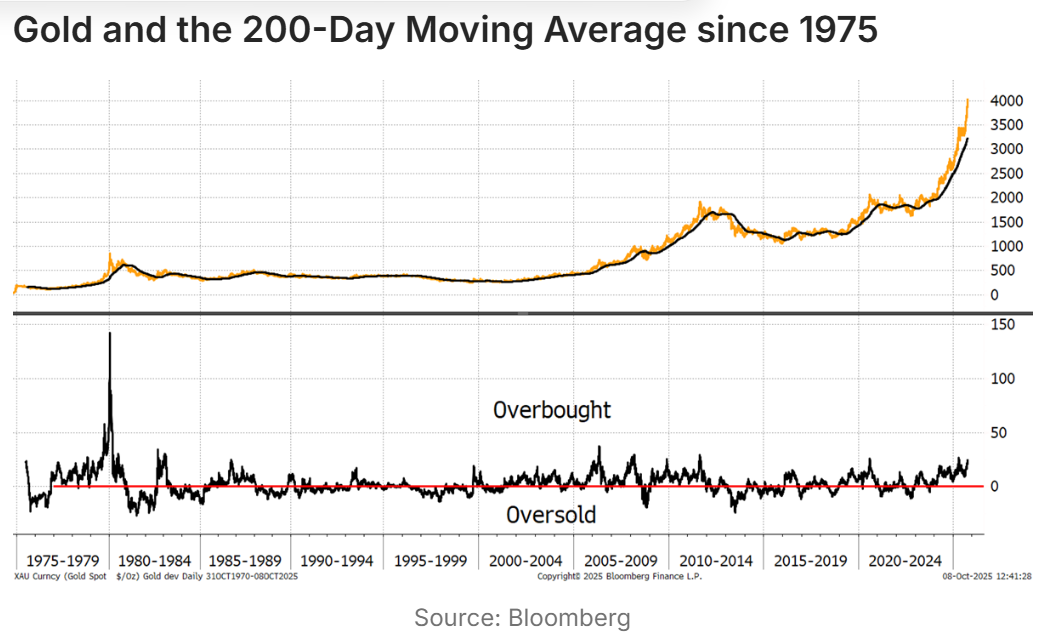
Morris noted that even 20 years’ worth of data is a drop in the bucket for gold’s price history, which spans over 6,000 years. “Using 85 years gives us another angle, but only with the US money supply data,” he said. “On this basis, gold is 50% above the average, having been 350% ahead in 1979.”
“If this gold bull market really is about debasement, we are a long way from the top.”
He added that under a currency debasement scenario, we should see “a surge in the money supply, which gold is presumably forecasting, just as it did in 2020,” but this has yet to occur.
“However, it’s not just the money supply; we should also factor in structural unfunded government deficits, and gold doesn’t like what it sees,” he wrote. “More accurately, perhaps, investors are concerned that there is no way out of this fiscal mess, and they see gold as a lifeboat.”
Morris said he used to closely follow the total value of the gold ETFs as a percentage of all ETFs, but as they have risen much faster than the market cap, he no longer sees them as a useful metric. He notes, however, that gold ETFs as a percentage of the global equity market cap now stands at 2.9%, or half the value of NVIDIA. “This is back to the peak levels seen in 2011, which should ring alarm bells.”
Spot gold continues to hold above the $4,000 per ounce level on Thursday, but it saw a sharp selloff at the North American market open immediately after charting a double-top at $4,057 per ounce.

Spot gold last traded at $4,010.52 per ounce for a loss of 0.78% on the session.