

(Kitco News) – With gold already trading over $4,100 on Monday afternoon following last week’s unprecedented break above $4,000 per ounce, even a conservative projection of the yellow metal’s medium-term investment demand suggests the price could reach $5,000 per ounce by the end of next year, according to commodity analysts at Societe Generale.
In the French banking giant’s latest commodity research report published Monday, analysts said that the gold price appears poised to gain another $1,000 in relatively short order.
“Last week, gold prices reached $4,042/oz, just $276/oz below our bullish $4,318/oz Q426 forecast we published just one month ago,” they wrote. “As of this morning, prices have risen to $4,072/oz. With ETF flows remaining strong, central bank buying expected to be resilient, we feel confident and compelled to update our target prices for gold.”
“We now see prices reaching $5000/oz by the end of 2026, as the rate of flows has surpassed our initial assumptions,” they said. “Despite having no clarity on positioning (flows) of hedge funds, we have observed what can only be described as extremely strong, admittedly higher than we forecasted, positive ETF flows in the last few weeks. Why is this increase in flows happening now? We have previously noted a strong relationship between ETF flows and uncertainty levels since the Trump victory in November 2024 and believe for now, this to be a critical factor in understanding part of the price action.”
SocGen analysts cautioned that the latest monthly FRED uncertainty indices from September do not take into account China’s sweeping export controls on rare earths on October 9th. “This index would also fail to capture that President Trump then announced, last Friday, to impose additional 100% tariffs on all Chinese goods and almost immediately signal openness to reach a deal to quell trade tensions,” they said. “However, stepping back from these recent events, we do note that in China the general (and trade) uncertainty indices dropped 80 (100) points during the month of September, yet Chinese ETF gold holdings rose to slightly 193t from 189t.

“Meanwhile, using our preferred weekly U.S. uncertainty index, which captures the period when China announced the rare earth export controls and Trump’s response last week, the level of uncertainty jumped to 354 - an increase of 18 points over the week and an increase of 44 points over the month (see upper right graphic),” they noted. “This, 354-level index, is still three times the level witnessed the 5 months prior to the U.S election.”
The analysts said that under the circumstances, it was not surprising to see global gold ETF flows rise by 23 tonnes over the last week – and by 100 tonnes in the last month alone. “Critically, however, our China economics team highlighted on Sunday there is less than a 30% chance of the new tariffs materializing, but these scenarios, realized or not, seem to cause massive flows into gold ETFs,” they wrote. “We cannot imagine a situation where we return to pre-Trump index uncertainty normalcy over our forecast horizon, so ETF flows are a key component to our price forecasting.”
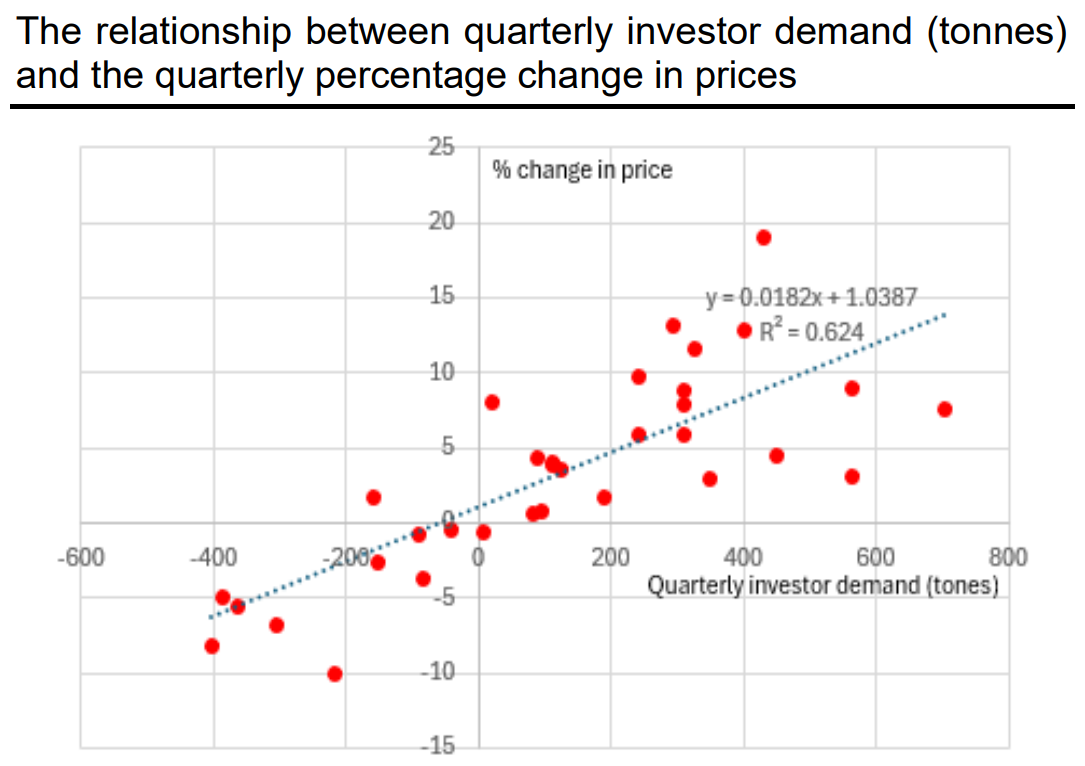
SocGen said they maintained the core assumptions in their September forecast. “Specifically, in that outlook, we presented the case for extremely resilient gold investor and central bank demand, and we outlined that since 2022, the average quarterly increase in flows has been 72.5t across all managed money, ETFs, central banks and demand for coins and bars,” the analysts said. “For ETFs in particular, (where we can currently observe almost real time transparency on flows), quarterly changes have averaged +31.5t since 2017.”
They added, however, “a highly significant 100t of flows into global gold ETFs, 69t more than ‘normal’” through the end of Q3. “This flow by itself partially explains the significantly increased gold price over the month of September,” the analysts wrote. “These elevated ETF flows, the highest level we have seen since Q3 2020 (when we witnessed 238t of positive flows) are significantly higher than our original flow assumptions, and explain, according to our framework, roughly $160/oz of the rise in gold prices over the course of the last three months.”
SocGen analysts said they continue to take “a conservative and cautious approach to flow forecasting and only assume an additional 67t of gold is purchased each quarter above ‘normal’ levels, for all categories of flows” – including central banks and ETFs – across all quarters.
“We do this despite the recent elevated uncertainty but maintain the view that central banks accumulate gold so the percentage is higher in their total reserves,” they said. “Therefore, we continue to add this incremental amount to average demand and use that in the model framework shown in the [above] chart to forecast prices through to the end of 2026 (our forecast horizon). Recalibrating our gold framework to forecast from today’s gold price (i.e., marking to market the base price but leaving assumptions unchanged), the model points to $4,217/oz by the end of 2025 and $5000/oz by the end of 2026, a 14% increase from our $4,300/oz we released in September.”
“Recognizing our conservative assumptions on ETF and central bank flows, we view the upside risk to our forecast is significantly greater than the downside,” they added.
Spot gold continues to rise further above the $4,100 per ounce level on Monday after setting a fresh all-time high of $ 4,117.42 just before 1:30 pm EDT.

Spot gold last traded at $4,106.09 for a loss of 2.23% on the session.